
To monitor system resources right now, open your platform's built-in real-time monitor and watch CPU, memory, disk I/O, network, and GPU metrics. Here are the fastest ways to start:
- Windows: Press
Ctrl + Shift + Escto open Task Manager, or runresmon.exein the Run dialog (Win + R) for the full Resource Monitor. - macOS: Open Spotlight (
Cmd + Space), type "Activity Monitor," and press Enter. - Linux: Type
htopin any terminal. If it is not installed, runsudo apt install htop(Debian/Ubuntu) orsudo dnf install htop(Fedora).
Quick one-line terminal commands:
# Linux
htop

# macOS
top -o cpu

# Windows (PowerShell)
Get-Process | Sort-Object CPU -Descending | Select-Object -First 10
Start with CPU utilization. A sustained high CPU usage on all cores points to a real bottleneck. Memory comes second: if available RAM drops too low, the system starts paging to disk, which slows everything down fast. Disk I/O queue length is the third signal to check, especially if the UI feels sluggish despite normal CPU readings.
Table of Contents
- Which built-in tools should you use per platform?
- What metrics actually matter and how to read them
- How to run real-time monitors on Windows, macOS, and Linux
- When to log data instead of watching in real time
- How to diagnose and fix common resource problems
- Research-backed monitoring habits and when to call for help
- How to set up automated alerts for resource thresholds
- Interpreting GPU usage and temperature data
- Scripting and automating resource monitoring from the command line
- Monitoring resources in virtualized and container environments
- Key Takeaways
- The case for boring monitoring habits
- Tempered gives you guided, reversible diagnostics for Windows
- Useful sources for deeper troubleshooting
Which built-in tools should you use per platform?
Every major OS ships with something useful out of the box. The question is knowing which tool to reach for first.
Windows gives you two overlapping options. Task Manager (Ctrl + Shift + Esc) is the fastest entry point: the Performance tab shows live CPU, memory, disk, and network graphs. Resource Monitor (resmon.exe) goes deeper, breaking down per-process disk and network activity with a filterable interface. Windows Performance Monitor (perfmon) adds configurable data collector sets, alerts, and historical logging — it is the right tool when you need more than a snapshot.

macOS centers on Activity Monitor (/Applications/Utilities/Activity Monitor). The five tabs (CPU, Memory, Energy, Disk, Network) cover everything a casual user needs. The Memory Pressure graph is particularly useful: green means fine, yellow means the system is managing, red means you have a problem.
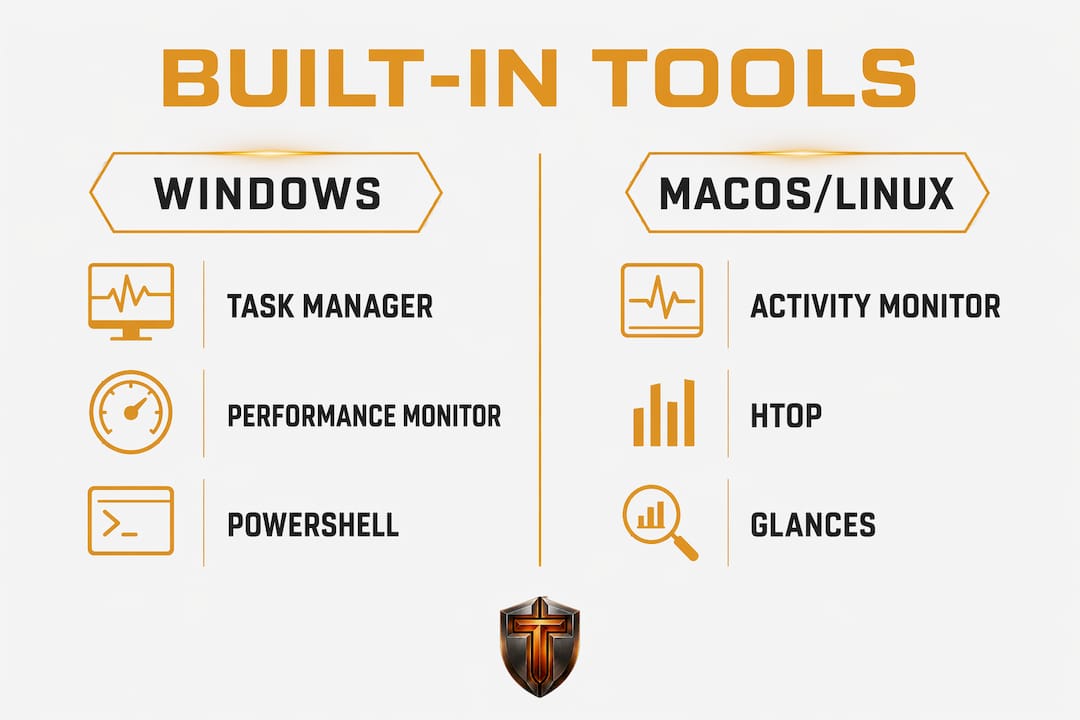
Linux offers the richest CLI ecosystem. top is available everywhere; htop adds color, mouse support, and easier process management. systemd-cgtop shows per-cgroup CPU, memory, and I/O data with a default 1-second refresh, which is ideal for container and service-level views. For GUI users, GNOME System Monitor covers process lists and resource graphs, while the Resources app (available as a Flatpak) adds GPU, network interfaces, and block device views in a clean layout.
Low-overhead cross-platform option: Glances runs on Windows, macOS, and Linux, presents a dashboard-style view in the terminal, and supports client/server and web modes for remote checks. It exports to CSV, InfluxDB, and Prometheus-compatible endpoints.
Pro Tip: Before running any monitor during a game or heavy workload, check the monitor's own CPU and memory usage first. A poorly chosen tool can consume enough resources to skew the very numbers you are trying to read, as NVIDIA's Nsight Systems guidance makes clear.
| Category | Real-time view | Historical logging | Low overhead | Scripting/export |
|---|---|---|---|---|
| Built-in utilities | Yes | Limited | Yes | Limited |
| Lightweight cross-platform tools | Yes | Partial | Yes | Yes |
| Advanced logging systems | Yes | Yes | Moderate | Yes |
What metrics actually matter and how to read them
Knowing which number to look at saves more time than any tool.
CPU utilization is the percentage of time each core spends on non-idle work. A brief spike to 100% is normal. Sustained high usage across all cores for more than 30–60 seconds means something is genuinely consuming compute. On Linux, load average (from /proc/loadavg or the kernel's /proc filesystem) is a different measure: it counts runnable and uninterruptible processes over 1, 5, and 15 minutes. A load average above your core count signals queuing. Windows and macOS report percent CPU, not load average, so the two metrics are not directly comparable.
Memory splits into used, available, and cached. The number that matters is available (or "free + reclaimable cache"), not raw free. When available memory shrinks toward zero, the OS starts swapping to disk. On Linux, watch /proc/meminfo's MemAvailable field. On macOS, the Memory Pressure graph is more reliable than the "used" figure alone. On Windows, check RAM usage through the Performance tab or dedicated RAM monitoring steps to separate committed memory from cached pages.
Disk I/O is measured in read/write throughput (MB/s) and queue length. A queue length above a small threshold on a single spinning disk usually means I/O-bound slowdowns. SSDs tolerate higher queue depths before performance degrades. High I/O with low CPU is a classic sign of a process hammering storage.
Network metrics to watch are throughput (MB/s), packet loss, and retransmit rate. Packet loss above 1% causes TCP to retransmit, which compounds latency. On Linux, ss -s or netstat -s shows retransmit counts.
GPU and temperature are covered in detail in a later section, but the short version: High GPU utilization sustained during gaming is expected; the same reading during a desktop task is not.
| Metric | Symptom when high | First tool to check |
|---|---|---|
| CPU utilization | Sluggish response, fan noise | Task Manager / htop |
| Memory pressure | Disk thrashing, app crashes | Activity Monitor / free -h |
| Disk queue length | Slow file opens, UI freezes | Resource Monitor / iostat |
| Network retransmits | Lag, slow downloads | netstat / ss -s |
| GPU temperature | Throttling, artifacts | GPU vendor utility / sensors |
Sampling intervals affect what you see. Short sampling windows can surface transient spikes that are irrelevant to overall performance, while long windows can hide brief but harmful bursts. Match your sampling rate to the workload's timescale.
How to run real-time monitors on Windows, macOS, and Linux
Windows
- Task Manager:
Ctrl + Shift + Esc→ Performance tab. Click any graph to see a per-core CPU breakdown. - Resource Monitor:
Win + R→ typeresmon→ Enter. Use the CPU, Memory, Disk, and Network tabs to filter by process. - Performance Monitor:
Win + R→ typeperfmon→ Enter. Add counters via the green "+" button. To start a quick data collector: right-click "Data Collector Sets" → New → Manual, then select the counters you want.
macOS
- Open Activity Monitor from
/Applications/Utilities/or via Spotlight. - In Terminal:
top -o cpusorts processes by CPU descending. Pressqto quit. - For memory stats:
vm_statin Terminal shows page faults, swap usage, and free pages in raw page counts (multiply by 4096 for bytes). - iStat Menus is a well-regarded third-party menu-bar option for persistent, low-overhead system resource usage overlays.
Linux
# Interactive process viewer, sorted by CPU
htop -s PERCENT_CPU

# Disk I/O per device (requires sysstat package)
iostat -xz 2

# Memory and swap in human-readable form
free -h

# Per-cgroup resource view (systemd)
systemd-cgtop

# Glances: full dashboard, refreshes every 2 seconds
glances

# Glances in web mode (access via browser at port 61208)
glances -w
When reading htop, the top bar shows per-core CPU bars and memory/swap gauges. The process list below is sorted by CPU by default. The PID column identifies the offending process; press F9 to send a signal (kill or renice) without leaving the interface.
For remote checks, glances --client <hostname> connects to a Glances server running on another machine, which is useful for headless servers.
When to log data instead of watching in real time
Real-time monitoring catches what is happening now. Logging catches what happened at 3 AM.
Instantaneous values show current state, while aggregated metrics reveal intermittent bottlenecks that a live watch would miss entirely. If a system slows down unpredictably or a service crashes overnight, you need historical data to diagnose it.
How to set up basic logging:
- Windows Performance Monitor: Open
perfmon→ Data Collector Sets → User Defined → right-click → New → Data Collector Set. Choose "Performance counter" and set a sample interval. Files land inC:\PerfLogs\by default. - Glances CSV export: Run
glances --export csv --export-csv-file /tmp/metrics.csv. Each refresh appends a row. For long-term storage, the InfluxDB exporter pairs well with Grafana dashboards. - Linux with PCP: Performance Co-Pilot packages as
pcpon most distributions. Runpmloggerto start collection;pmrepqueries the archive. PCP integrates with Grafana via thepcp-export-pcp2graphitebridge.
Sampling rate tradeoffs: a 1-second interval gives high resolution but generates large files quickly. For long-term trend storage, 10–60 seconds per sample is usually sufficient and keeps files manageable. Rotate logs weekly or set a maximum file size to avoid filling the disk.
Pro Tip: Before committing to a long-term logging setup, run the collector for 30 minutes and check its own CPU and memory footprint. Some logging agents, especially those with aggressive sampling, add measurable overhead on low-spec machines.
How to diagnose and fix common resource problems
Seeing a high number is the easy part. Knowing what to do next is where most guides stop short.
CPU spikes
- Identify the process: in Task Manager or
htop, sort by CPU and note the PID and process name. - Check if it is a one-time burst (compiler, updater) or persistent. Persistent high CPU from a background service often means a runaway daemon or a driver issue.
- On Windows, use Process Explorer (from Microsoft Sysinternals) to inspect thread-level CPU usage and loaded DLLs.
- Try restarting the offending service. If that does not help, check for pending software updates or driver updates.
- For gaming, Windows 11 debloat steps can reduce background CPU consumption from unnecessary startup programs.
Memory pressure
- Identify the largest consumers: in
htop, pressMto sort by memory; on macOS, sort Activity Monitor by "Memory" column. - On Linux, check PSS (Proportional Set Size) via
/proc/PID/smaps_rollupfor a more accurate per-process memory picture than RSS alone. - Restart leaking processes. If memory grows steadily over hours without releasing, that is a leak, not normal caching.
- Increasing swap (Linux) or virtual memory (Windows) buys time but does not fix the root cause.
Disk I/O bottlenecks
- Use
iostat -xz 2(Linux) or Resource Monitor's Disk tab (Windows) to find the high-write PID. - Check application logs: excessive debug logging is a surprisingly common cause of high I/O.
- Run a SSD health check to rule out a failing drive before assuming software is the problem.
- On Windows, verify TRIM is enabled:
fsutil behavior query DisableDeleteNotifyshould return0.
Network saturation
- On Linux,
ss -tpshows which process owns each connection.iperf3tests raw bandwidth to isolate whether the bottleneck is local or upstream. - High retransmit counts in
netstat -spoint to packet loss, not just congestion. - Check router QoS settings if one device is saturating shared bandwidth.
GPU and temperature issues
- Dust and restricted airflow are the most common causes of sustained high GPU temperatures. Clean the heatsink before updating drivers.
- Enable frame-rate limits in your game's settings or via the GPU driver panel to prevent the GPU from running at 100% utilization on menus and loading screens, where it generates heat without producing useful frames.
- Enabling GPU hardware-accelerated scheduling on Windows 10/11 can reduce CPU overhead and improve frame pacing.
Research-backed monitoring habits and when to call for help
The most common mistake is treating every spike as a crisis. Effective monitoring focuses on trends and bottleneck analysis rather than reacting to every instantaneous reading, which cuts false positives and wasted troubleshooting time.
Tracking both short-interval real-time metrics and longer-term aggregates is best practice because instantaneous values show current state while aggregated metrics (p95/p99, averages) reveal intermittent bottlenecks that a live watch would miss entirely.
A few technical caveats practitioners often overlook: OS-level CPU, memory, and I/O accounting must be enabled for per-process data to be accurate. On Linux, if systemd accounting is disabled for a service, monitors will show incomplete or zero values for that service's resource consumption. This is a common source of confusion when container metrics look suspiciously low.
When to escalate beyond self-service troubleshooting:
- Resource pressure persists after basic remediation (process restarts, driver updates, cleanup).
- Hardware error indicators appear: SMART errors on drives, GPU memory errors, or repeated kernel panics.
- The system runs in a virtualized or containerized environment where host-level and guest-level metrics diverge in ways that are hard to interpret without specialized tooling.
- A production server shows unexplained latency spikes that correlate with no obvious process.
For those last two scenarios, tools like Performance Co-Pilot with multi-host collection, or a managed observability platform, are more appropriate than a single-machine CLI session.
How to set up automated alerts for resource thresholds
Watching a dashboard manually is not a monitoring strategy. Alerts are.
Windows Performance Monitor supports threshold-based alerts natively. In perfmon, create a Data Collector Set, add an "Alert" data collector, set the counter (e.g., \Processor(_Total)\% Processor Time), and define a threshold. When the counter crosses it, Performance Monitor can log an event, run a program, or send a network message.
Linux with Glances: Glances has a built-in alert system. Edit ~/.config/glances/glances.conf and set thresholds per metric:
[cpu]
careful=70
warning=80
critical=90
Color-coded alerts appear in the terminal UI. For notifications outside the terminal, pipe Glances output to a script or use its REST API (glances -w) to poll from an external alerting tool.
Prometheus + Alertmanager is the standard stack for server environments. Prometheus scrapes metrics from exporters (node_exporter for Linux hardware metrics, windows_exporter for Windows), and Alertmanager routes alerts to email, Slack, PagerDuty, or webhooks. A basic CPU alert rule looks like:
- alert: HighCPU
  expr: 100 - (avg by(instance)(rate(node_cpu_seconds_total{mode="idle"}[5m])) * 100) > 85
  for: 5m
  labels:
    severity: warning
The for: 5m clause prevents alerts from firing on transient spikes, which is the single most useful tuning parameter for reducing alert fatigue.
macOS does not have a built-in threshold alert system comparable to perfmon. The practical option is a third-party menu-bar tool like iStat Menus, which supports custom notifications when CPU, memory, or temperature thresholds are crossed.
Interpreting GPU usage and temperature data
GPU monitoring is where most guides give vague advice. Here is what the numbers actually mean.
GPU utilization measures how much of the GPU's shader execution units are active. During gaming, 95–99% utilization is the target: it means the GPU is the bottleneck, not the CPU, which is exactly where you want the bottleneck for maximum frame rates. If GPU utilization sits at 40–60% during gaming, the CPU is likely the bottleneck, or the game is not GPU-limited at that resolution.
GPU memory (VRAM) usage matters separately from utilization. Exceeding available VRAM forces the driver to page to system RAM, which causes severe frame time spikes. Watch VRAM usage in your GPU vendor's overlay tool (NVIDIA's in-game overlay or AMD's Radeon Software overlay) and stay below 90% of total VRAM as a safe ceiling.
Temperature thresholds vary by GPU generation and manufacturer, but general guidance holds:
- Below 80°C under load: normal operating range for most discrete GPUs.
- 80–90°C: acceptable for many modern GPUs designed for this range, but worth monitoring airflow.
- Above 90°C sustained: thermal throttling is likely. The GPU reduces clock speeds to protect itself, which shows up as frame rate drops.
- Junction temperature (hotspot) on AMD GPUs can read 10–20°C higher than the average die temperature; this is expected and not a fault.
For CPU temperature monitoring on Windows, the same principle applies: brief spikes are normal, sustained readings near the thermal junction maximum (Tjmax) are not.
GPU vendor tools: NVIDIA's nvidia-smi command reports utilization, VRAM usage, temperature, and power draw in one output. On Linux, nvidia-smi dmon -s pucvmet streams per-second metrics. AMD GPUs expose data via rocm-smi on Linux or the Radeon Software overlay on Windows.
Scripting and automating resource monitoring from the command line
Manual checks are fine for one-off troubleshooting. Scripts are better for anything recurring.
Linux: shell script for periodic snapshots
#!/bin/bash
LOGFILE="/var/log/resource_snapshot.log"
while true; do
  echo "=== $(date) ===" >> "$LOGFILE"
  top -bn1 | head -20 >> "$LOGFILE"
  free -h >> "$LOGFILE"
  iostat -xz 1 1 >> "$LOGFILE"
  sleep 60
done
Run this with nohup ./monitor.sh & to keep it running after logout. For production use, a systemd service unit is cleaner than nohup.
Windows: PowerShell one-liner for CPU and memory logging
while ($true) {
  $cpu = (Get-WmiObject Win32_Processor | Measure-Object -Property LoadPercentage -Average).Average
  $mem = (Get-WmiObject Win32_OperatingSystem)
  "$((Get-Date).ToString()) CPU: $cpu% | Free RAM: $([math]::Round($mem.FreePhysicalMemory/1MB,1)) GB" | Tee-Object -Append -FilePath C:\Logs\resource_log.txt
  Start-Sleep -Seconds 30
}
Python: cross-platform with psutil
The psutil library reads CPU, memory, disk, and network metrics on Windows, macOS, and Linux with a single API. A basic polling script:
import psutil, time, csv

with open("metrics.csv", "w", newline="") as f:
    writer = csv.writer(f)
    writer.writerow(["timestamp", "cpu_pct", "mem_pct", "disk_read_mb", "disk_write_mb"])
    while True:
        disk = psutil.disk_io_counters()
        writer.writerow([
            time.strftime("%Y-%m-%d %H:%M:%S"),
            psutil.cpu_percent(interval=1),
            psutil.virtual_memory().percent,
            round(disk.read_bytes / 1e6, 2),
            round(disk.write_bytes / 1e6, 2)
        ])
        time.sleep(10)
This writes a CSV you can open in Excel, import into Grafana, or analyze with pandas. The Python resource module also exposes OS-level resource limits and consumption for the current process, which is useful for profiling scripts themselves.
Monitoring resources in virtualized and container environments
Virtualized and containerized systems add a layer of indirection that breaks naive monitoring assumptions.
In a VM, the guest OS sees virtualized hardware. The CPU percentage inside the guest reflects usage against the vCPU allocation, not the physical host's total capacity. A guest showing 50% CPU might correspond to 5% or 95% of a physical core depending on host load and hypervisor scheduling. Always monitor at both the host level and the guest level to get the full picture.
Containers share the host kernel, so tools like top or htop inside a container show host-wide process lists by default, not just container processes. The correct approach is to use cgroup-aware tools. systemd-cgtop shows per-cgroup resource usage directly. For Docker containers, docker stats streams live CPU, memory, network, and block I/O per container. For Kubernetes pods, kubectl top pod queries the metrics-server.
In virtualized and containerized environments, distinguishing host-level resource pressure from guest or container-level usage requires cgroup-aware tools to avoid misattribution. A container that looks healthy by its own metrics can still be starved if the host is under pressure.
Performance Co-Pilot supports multi-host metric collection and can aggregate data from both host and container layers into a single view, which makes it a practical choice for teams running mixed physical and virtualized infrastructure.
For Kubernetes at scale, the standard stack is Prometheus with kube-state-metrics and node_exporter, feeding dashboards in Grafana. Container resource limits (resources.limits.cpu and resources.limits.memory in pod specs) define the cgroup boundaries that monitoring tools read from.
Key Takeaways
The most reliable way to monitor system resources is to combine a built-in real-time tool for immediate checks with a lightweight logger for trend analysis, then act on sustained patterns rather than isolated spikes.
| Point | Details |
|---|---|
| Start with built-in tools | Task Manager, Activity Monitor, and htop give immediate CPU, memory, and disk readings with zero setup. |
| Match the tool to the workload | Use low-overhead monitors like Glances during gaming or intensive tasks to avoid skewing your own metrics. |
| Log for intermittent problems | Set up Performance Monitor data collector sets or Glances CSV export to catch issues that only appear overnight or under specific load. |
| Act on trends, not spikes | A single CPU spike is normal; sustained high utilization across all cores for 30–60 seconds signals a real bottleneck worth investigating. |
| Tempered for Windows diagnostics | Tempered's AI diagnostic tool analyzes live CPU, RAM, GPU, and disk metrics on Windows 10/11 and recommends plain-language fixes with one-click Undo. |
The case for boring monitoring habits
Most people open a system monitor when something already feels wrong. That is the least useful time to start.
The guides that actually help are the ones that push you toward a routine: a quick htop glance before a long compile, a weekly look at disk I/O trends, a temperature check after a new game install. None of that is glamorous. But it is how you catch a failing drive before it takes your data, or notice that a background updater has been eating 15% CPU for three weeks.
The other thing worth saying plainly: more data is not always better. A dashboard with 40 metrics is harder to act on than one with five. The Resources app's design philosophy of balancing information richness with UI clarity is the right instinct. Pick the metrics that matter for your workload, set a threshold alert for the ones that would actually change your behavior, and ignore the rest.
For Windows users who want guided diagnostics without building a monitoring stack from scratch, Tempered sits in a useful middle ground between a raw CLI session and a full observability platform.
Tempered gives you guided, reversible diagnostics for Windows
If you have worked through this guide and want a faster path to fixes on Windows, Tempered does the diagnostic work for you. It analyzes live CPU, RAM, GPU, and disk metrics in real time, identifies what is actually dragging performance down, and delivers plain-language recommendations you can act on without reading a man page.
Every change Tempered suggests is tracked in its Undo Center, so nothing is permanent. The freemium model means you can run an AI scan and see what it finds before committing to anything. Game Mode, startup management, and background process controls are all built in.
- AI-driven scans that flag real inefficiencies, not generic advice
- Plain-language recommendations with no technical knowledge required
- One-click Undo for every change the tool applies
- Freemium tier available: scan first, decide later
Try Tempered free and see what your system is actually doing under the hood.
Useful sources for deeper troubleshooting
These are the primary references worth bookmarking if you want to go further than this guide covers.
| Source | Use case | What you will find |
|---|---|---|
| Windows Performance Monitor (Lenovo/Microsoft) | Quick checks and logging on Windows | Counter setup, data collector sets, alert configuration |
| systemd-cgtop man page | Linux cgroup and container monitoring | Per-cgroup CPU/memory/IO, accounting requirements |
| Glances on GitHub | Cross-platform lightweight monitoring | Installation, export options, client/server mode |
| Performance Co-Pilot | Long-term multi-host logging | PMAPI, pmrep, Grafana integration, OpenTelemetry export |
| Linux /proc filesystem docs | Deep Linux kernel metrics | Raw CPU, memory, I/O, and process data from the kernel |
| GNOME System Monitor | Linux GUI monitoring | Process list, resource graphs, file system view |
| Resources app (GitHub) | Linux GUI with GPU and network | CPU, memory, GPU, network interfaces, block devices |