
CPU temperature is the single most important hardware metric for preventing performance loss and hardware damage on a Windows PC. When a processor runs too hot, it throttles its own clock speed to cool down, which directly cuts your frame rates, slows your apps, and shortens the chip's lifespan. Knowing how to monitor CPU temperature gives you the visibility to catch problems before they become permanent. This guide covers every reliable method, from BIOS checks to per-core software monitoring, so you can keep your system running at its best.
What tools do you need to monitor CPU temperature?
The right tool depends on how much detail you need. Windows itself offers almost nothing useful here. Task Manager lacks temperature data on most systems because Windows prioritizes performance metrics and limits direct hardware sensor access. That means third-party software is the standard solution for anyone who wants accurate, real-time readings.
Three tools cover the full range of needs:
- Core Temp reads Digital Thermal Sensor (DTS) data embedded directly in modern Intel and AMD processors. It shows per-core temperatures in real time and displays them in the system tray. Core Temp sets up in roughly 30 seconds and uses minimal system resources, making it the best starting point for most users.
- HWiNFO64 goes deeper. It reads temperatures, voltages, fan speeds, and power draw across every major component. Its Sensors-only mode gives you a full-system view without the overhead of the full interface.
- Open Hardware Monitor supports Intel and AMD cores alongside GPU sensors and displays readings in the system tray, making it a solid lightweight alternative.
| Tool | Best for | Per-core temps | System tray | Logging |
|---|---|---|---|---|
| Core Temp | Quick setup, beginners | Yes | Yes | Basic |
| HWiNFO64 | Advanced diagnostics | Yes | Yes | CSV export |
| Open Hardware Monitor | Lightweight all-rounder | Yes | Yes | No |
Pro Tip: When installing Core Temp, uncheck the bundled software offer during setup. It is easy to miss and installs an unwanted program.
How to check CPU temp through BIOS/UEFI
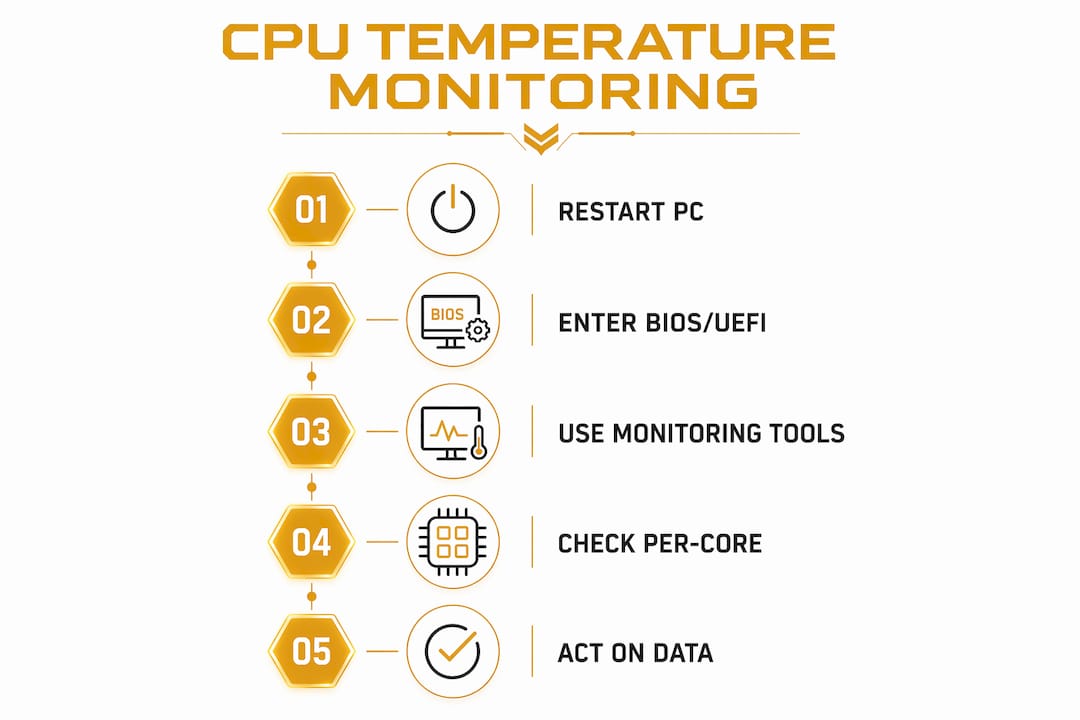
BIOS access is the most reliable no-download method to check CPU temperature. BIOS/UEFI firmware reads hardware sensor data directly, bypassing Windows entirely, which makes it useful when you cannot install software or when you suspect an OS-level issue.
- Restart your PC and press the BIOS key immediately as the manufacturer logo appears. Common keys are F2, Del, and Esc. The correct key varies by motherboard brand, so check your manual if the first attempt fails.
- Once inside BIOS, look for a section labeled "Hardware Monitor," "PC Health Status," or "System Information." The exact name depends on your motherboard firmware.
- Find the CPU temperature reading. It will show a static value in degrees Celsius.
- Compare the reading to your CPU's safe idle range. Most desktop processors run between 30°C and 50°C at idle.
- Exit BIOS without saving changes by pressing Esc or selecting the exit option.
The key limitation here is that BIOS shows only idle temperatures recorded before the operating system loads. You cannot see what happens under load, and you cannot track temperature over time. This method works well for a quick sanity check after a new build or a cooling upgrade, but it is not a substitute for real-time software monitoring.
Pro Tip: If your BIOS temperature reads unusually high even at idle, check that your CPU cooler is seated correctly before assuming the chip itself is faulty.
How to use Core Temp and HWiNFO64 for per-core monitoring
Per-core temperature monitoring is the standard that professional diagnostics demand. Monitoring each core individually reveals which cores run hot under load, which a single average reading would hide entirely.
Setting up Core Temp
- Download Core Temp from its official website and run the installer.
- Uncheck any bundled offers during installation.
- Launch the program. The main window shows the current temperature for each core and the Tj Max value.
- Right-click the system tray icon to keep readings visible without opening the full window.
Tj Max is the maximum safe junction temperature for your specific CPU. Intel CPUs commonly carry a Tj Max of 100°C, and the processor begins throttling its speed before reaching that ceiling to avoid damage. Your goal is to stay well below Tj Max under load, ideally 20°C or more away from it.
Setting up HWiNFO64
HWiNFO64 is the tool to reach for when you need the full picture. Its Sensors-only mode and CSV logging let you visualize temperature spikes over time and compare them against system load, which is exactly what you need for diagnosing intermittent overheating.
- Download HWiNFO64 from the official site and run it in portable mode if you prefer no installation.
- At the startup prompt, check "Sensors-only" and click Run.
- Scroll to the CPU section in the sensor list. Look for "CPU Package" (the overall processor temp) and individual core readings.
- Click the logging icon to start a CSV export. Run your workload, then open the file in Excel or Google Sheets to review temperature behavior over time.
- Set custom alerts by right-clicking any sensor value and selecting "Configure." Enter a threshold temperature to receive a warning before things get critical.
Pro Tip: Focus on the "CPU Package" temperature in HWiNFO64 as your primary health indicator. It reflects the hottest point across all cores and gives you the most conservative safety margin.
The difference between current and maximum logged temperatures tells you a lot. A CPU that peaks at 85°C for two seconds during a render is in a different situation than one that holds 90°C for ten minutes during a game session.
Common mistakes when checking CPU temperature
The biggest mistake is trusting the wrong tool. Command Prompt WMIC queries for temperature depend entirely on motherboard sensor support and frequently return zero or impossibly low values on unsupported hardware. Running a WMIC command and seeing "0" does not mean your CPU is cold. It means the query failed silently.
Relying on a single average temperature reading instead of per-core data is the most common reason users miss early signs of thermal throttling. One hot core in a six-core processor will not move the average much, but it will absolutely affect the tasks running on that core.
A few other pitfalls to avoid:
- Ambient and motherboard temps are not CPU temps. Generic tools sometimes report case or VRM temperatures and label them ambiguously. Always confirm you are reading DTS data from the processor itself, not a nearby sensor.
- Idle readings do not reveal throttling. Thermal issues appear only under stress, so checking temperature while your PC sits at the desktop tells you almost nothing about gaming or rendering performance.
- Software detection failures happen when a tool cannot find your CPU sensor. Try running the program as administrator first. If that fails, update the software to the latest version, since sensor databases are updated regularly for new CPU models.
When temperatures consistently run high, the physical fixes matter as much as the software. Cleaning dust from heatsinks and fans, reapplying thermal paste after two to three years, and improving case airflow all reduce temperatures more reliably than any software setting.
Pro Tip: Thermal paste degrades over time. If your CPU runs hotter than it did two years ago with no other changes, replacing the thermal paste is the first physical fix to try.
How to track CPU temperature during gaming and heavy loads
Real-time monitoring during gaming is where per-core tracking pays off most. MSI Afterburner integrated with HWiNFO64 displays CPU temperatures as an on-screen overlay while you play, so you never need to alt-tab to check your readings.
Setting up the overlay takes a few steps:
- Install MSI Afterburner and run HWiNFO64 in Sensors-only mode simultaneously.
- In HWiNFO64, right-click the CPU temperature sensor you want to display and select "Add to MSI Afterburner."
- Open MSI Afterburner, go to Settings, then the Monitoring tab, and enable the CPU temperature entry for on-screen display.
- Launch your game. The temperature will appear as an overlay in the corner of your screen.
- Enable HWiNFO64 logging at the same time to capture a full session record for later review.
Watch for these warning signs during a gaming session:
- CPU Package temperature climbing above 90°C and staying there
- Frame rate drops that coincide with temperature spikes (a clear sign of thermal throttling)
- Core temperatures that vary widely between cores, which can indicate a cooler contact problem
- Temperatures that keep rising throughout a session without stabilizing
Thermal throttling is the processor's self-defense mechanism. When the chip gets too close to Tj Max, it reduces its clock speed to generate less heat. The result is a direct performance hit that shows up as stuttering, lower frame rates, and slower load times. Catching it through temperature logging gives you the data to fix the root cause rather than guessing.
Key takeaways
Accurate CPU temperature monitoring requires per-core, real-time data from DTS-based tools like Core Temp or HWiNFO64, not Windows Task Manager or WMIC commands.
| Point | Details |
|---|---|
| Use DTS-based tools | Core Temp and HWiNFO64 read accurate per-core data directly from the processor. |
| Know your Tj Max | Intel CPUs typically throttle near 100°C; stay at least 20°C below that under load. |
| Monitor under load | Idle temps reveal nothing about throttling; always check during gaming or heavy tasks. |
| Avoid unreliable methods | Task Manager and WMIC queries frequently return missing or incorrect temperature data. |
| Log for diagnostics | HWiNFO64 CSV logging captures temperature spikes over time for accurate troubleshooting. |
Why I trust per-core data over everything else
Most articles on this topic tell you to "just download a tool and check your temps." That advice skips the part that actually matters: what you do with the data.
I have seen plenty of systems where the average CPU temperature looked fine but one core was running 15°C hotter than the rest. That kind of imbalance points directly to a cooler that is not making full contact, or a thermal paste application that missed a corner of the IHS. A single average reading would have passed that system as healthy.
The other thing I push back on is the instinct to check temperature only when something feels wrong. By the time your PC is crashing or throttling badly enough to notice, the problem has been building for weeks. Regular monitoring during normal workloads catches the slow drift upward before it becomes a crisis.
My firm recommendation: skip Task Manager and CMD scripts entirely for temperature data. They are not built for it and they will mislead you. Core Temp for a quick daily check, HWiNFO64 with logging for any serious diagnostic work. That combination covers everything from a casual gaming session to a full thermal stress test.
The physical side matters just as much as the software side. No monitoring tool fixes a clogged heatsink. Use the data to guide action, not just to watch numbers.
— Ian
Tempered works alongside your CPU monitoring setup

Knowing your CPU temperature is the first step. Acting on what the data tells you is where most users get stuck. Tempered is an AI PC optimizer that analyzes real-time hardware metrics including CPU, RAM, and GPU temperatures, then recommends specific actions to address inefficiencies. It identifies background processes that push your CPU harder than necessary and lets you manage startup programs through a simple interface. Every change is reversible through Tempered's built-in Undo Center, so there is no risk of breaking your setup. For gamers and everyday PC users who want better performance without digging through settings manually, Tempered turns temperature data into results.
FAQ
What is a safe CPU temperature range?
Most desktop CPUs run safely between 30°C and 50°C at idle and up to 80°C–90°C under full load. Sustained temperatures above 90°C indicate a cooling problem that needs attention.
Why does Task Manager not show CPU temperature?
Task Manager lacks CPU temperature because Windows limits direct hardware sensor access in its architecture. Third-party tools that read DTS data from the processor are required for accurate readings.
What is Tj Max and why does it matter?
Tj Max is the maximum safe junction temperature for your CPU. Intel CPUs commonly set Tj Max at 100°C, and the processor throttles its speed automatically before reaching that limit to prevent damage.
How do I check CPU temp without installing software?
Restart your PC and enter BIOS/UEFI by pressing F2, Del, or Esc at startup. Navigate to the Hardware Monitor section to see a static idle temperature reading without any software download.
How often should I check my CPU temperature?
Check CPU temperature during any demanding task like gaming, video editing, or large file transfers. Monitoring under load is the only reliable way to catch thermal throttling before it affects your performance.