
How to check RAM usage in Windows using Task Manager
The fastest way to check RAM usage on Windows is Task Manager. Press Ctrl+Shift+Esc to open it instantly, or right-click the taskbar and select "Task Manager." From there, click the Performance tab and select Memory in the left panel.
What you see immediately:
- Total RAM installed (e.g., 16.0 GB)
- In Use memory in GB, shown as a live graph
- Available memory ready for new processes
- Speed (MHz), Slots used, and Form Factor (SODIMM or DIMM)
- Usage percentage in the graph title
That single screen tells you whether your system is under pressure right now. If "In Use" is pushing close to your total, you have a real bottleneck. Moderate usage levels often indicate Windows is just doing its job.
To customize the columns in the Processes tab:
- Open Task Manager and click the Processes tab.
- Right-click any column header.
- Select Memory to add a dedicated memory column.
- Click the column header to sort processes from highest to lowest RAM consumption.
For command-line users, PowerShell gives you the same data without opening a GUI. Run this in an elevated PowerShell window:
Get-CimInstance Win32_OperatingSystem | Select-Object TotalVisibleMemorySize, FreePhysicalMemory
This returns total and free physical memory in kilobytes. Divide by 1,048,576 to convert to GB.
Pro Tip: Press Windows + R, type resmon, and hit Enter to jump straight to Resource Monitor for a deeper view without navigating through Task Manager menus.
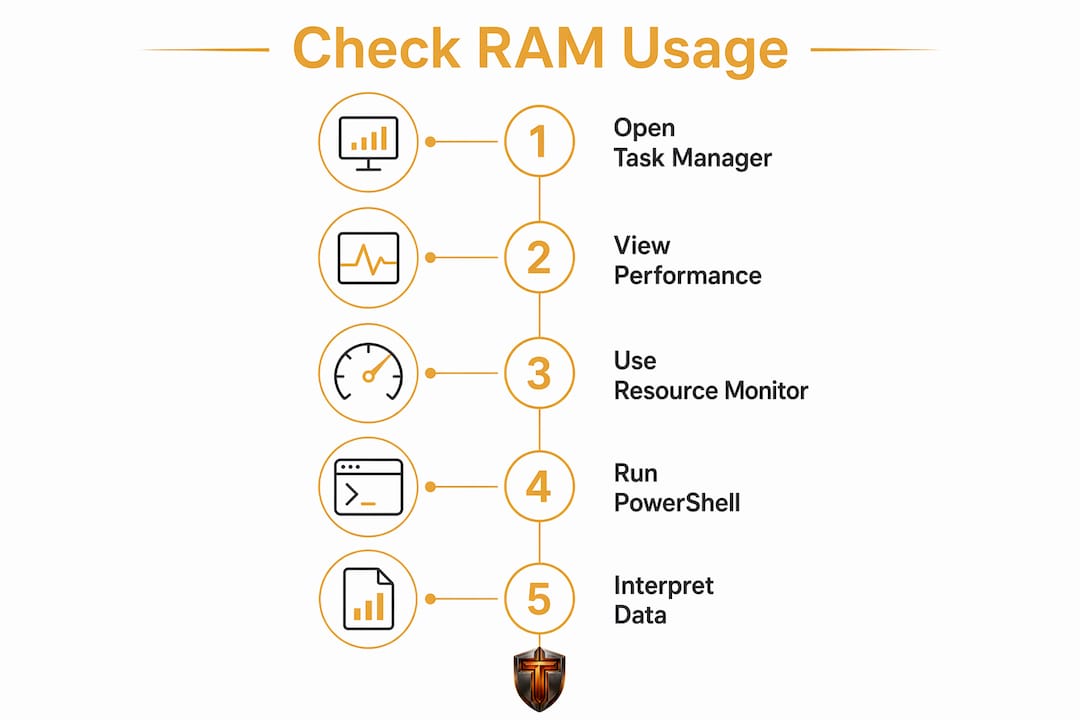
Table of Contents
- Resource Monitor gives you a real breakdown of memory by process
- What RAM usage readings actually tell you about performance
- How to troubleshoot high RAM usage on Windows
- How AI-powered tools simplify RAM monitoring and optimization
- Checking RAM usage with PowerShell commands
- Tempered makes RAM monitoring work for you, not against you
- Key Takeaways
Resource Monitor gives you a real breakdown of memory by process
Task Manager shows the summary. Resource Monitor shows the story behind it. Open it by pressing Win+R, typing resmon, and hitting Enter. You can also reach it from Task Manager's Performance tab by clicking "Open Resource Monitor" at the bottom.
Click the Memory tab. Here's what each column actually means:
- Working Set: Total RAM the process is actively using, including shared memory.
- Private (KB): Memory reserved exclusively for that process, not shared with others. This is the most reliable indicator of a process's true footprint.
- Hard Faults/sec: The number of times per second Windows had to pull data from the page file on disk because it wasn't in RAM. Even a few hard faults per second can slow your system noticeably.
- Commit (KB): Virtual memory committed to the process, including what may be paged to disk.
The Memory Bar at the bottom of the screen is one of the most useful visualizations Windows offers. It's color-coded:
- Blue (In Use): Actively used by running processes.
- Orange (Modified): Changed in memory but not yet written to disk.
- Gray (Standby): Cached data Windows is holding in case you need it again.
- Green (Free): Immediately available with no reclaiming needed.
One thing that trips up a lot of users: svchost.exe appears multiple times in the list. Windows bundles dozens of background services under that single process name. To identify which service inside svchost.exe is eating memory, right-click the entry and select "Go to Service(s)." Resource Monitor will highlight the specific services tied to that PID, letting you pinpoint the actual culprit.
Key metric to watch: Sort the Memory tab by "Hard Faults/sec." If any process is consistently generating hard faults, that's where your performance problem lives, not necessarily the process with the highest Working Set.
What RAM usage readings actually tell you about performance
A high RAM usage percentage is not automatically a problem. Windows is designed to use available memory aggressively because idle RAM is wasted RAM. The operating system caches recently used files and data in Standby memory so they load faster next time. That's why a system with 16 GB of RAM might show 12 GB "in use" while running perfectly smoothly.
The four memory states you'll see in Resource Monitor and RAMMap tell the real story:
- Active: Memory currently being read or written by a process.
- Standby: Cached data that can be reclaimed instantly if an app needs RAM.
- Modified: Data that's been changed but not yet saved to disk.
- Free: Completely empty memory, ready immediately.
Standby memory is not "used up." Windows will reclaim it the moment a new process needs space. So if your Task Manager shows 80% usage but most of that is Standby, your system is fine.
Memory compression adds another layer. When physical RAM runs low, Windows compresses less-active data in memory before resorting to paging. You'll see a "Compressed" entry in Task Manager's Memory section. Compression is a sign of pressure, but it means the system is still managing without hitting the page file. Once hard faults start climbing, the system has moved past compression and is actively paging to disk.
The practical takeaway: ignore the raw percentage. Watch hard faults per second and the size of your Compressed memory. Those two numbers tell you whether your PC is actually struggling.
How to troubleshoot high RAM usage on Windows
High memory usage that's causing slowdowns usually has a specific cause. Here's how to find and fix it systematically.
-
Sort by Hard Faults/sec in Resource Monitor. Open Resource Monitor, go to the Memory tab, and click the "Hard Faults/sec" column header. Any process generating consistent hard faults is forcing Windows to use the page file, which is slow. That process is your first target.
-
Check for memory leaks. A memory leak happens when a process keeps consuming more RAM over time without releasing it. Open Task Manager, sort by Memory, and watch the numbers over 10–15 minutes. A process whose memory footprint keeps climbing without a clear reason is leaking.
-
Close unnecessary background apps. Press Ctrl+Shift+Esc, click the Processes tab, and look for apps you're not actively using. Right-click and select "End Task" on anything consuming significant memory that you don't need running.
-
Disable startup programs. Open Task Manager, click the Startup Apps tab (Windows 11) or Startup tab (Windows 10). Disable anything you don't need launching at boot. Fewer startup programs mean more free RAM from the moment Windows loads.
-
Use Performance Monitor for trends over time. Press Win+R, type
perfmon, and hit Enter. Add a counter for "Memory\Pages/sec" to track paging activity over time. A sustained Pages/sec above a low baseline suggests ongoing memory pressure, not just a temporary spike. -
Use RAMMap for advanced analysis. RAMMap from Sysinternals is free, portable, and requires admin rights. It breaks down memory allocation into categories like File-Mapped, Kernel Stack, and Standby that Task Manager never shows. If you want to reclaim Standby memory, use RAMMap's "Empty Standby List" option. It's safe and won't touch active processes.
-
Avoid aggressive memory-clearing scripts. Third-party "RAM cleaners" that forcibly flush all cached memory often hurt performance. They clear Standby memory that Windows was using as a cache, forcing the system to reload data from disk the next time it's needed. Clearing Standby memory with RAMMap is the safe exception because it's targeted and transparent.
Pro Tip: Don't react to a single high-usage reading. Memory spikes during a game load or browser tab burst are normal. Monitor over 10–15 minutes and look for sustained hard faults or a process whose memory keeps climbing. That's the signal worth acting on.
How AI-powered tools simplify RAM monitoring and optimization
Reading Task Manager and Resource Monitor takes practice. The numbers are accurate, but interpreting them correctly requires knowing what "normal" looks like for your specific hardware and workload. Most users either panic at 80% usage (which is often fine) or miss a genuine memory leak because the signal is buried in a column they've never sorted.

AI diagnostic tools change that equation. Instead of presenting raw metrics, they translate the data into plain-language recommendations: "This background process is consuming 1.2 GB and hasn't been used in 3 days. Disabling it at startup would free significant memory." That's a different experience than staring at a list of PIDs.
Tempered is built around exactly this approach. It analyzes live hardware metrics including RAM, CPU, GPU, and disk in real time, then surfaces specific recommendations without requiring you to know what a hard fault is or why svchost.exe appears 14 times. Key features that matter for memory management:
- Automated background process management: Identifies and manages processes consuming RAM without active use.
- Startup control: Lets you customize which programs launch at boot, with all changes reversible through the built-in Undo Center.
- Game Mode: Reallocates resources during gaming sessions to prioritize active applications over background services.
- Plain-language recommendations: No technical jargon. The tool tells you what to do, not just what the numbers are.
- One-click Undo: Every change Tempered makes is tracked and reversible, so there's no risk of breaking something.
Pro Tip: If you're using Tempered alongside manual monitoring, cross-reference its recommendations with Resource Monitor's Hard Faults/sec column. When both point to the same process, you have high confidence the fix is the right one.
For users who want to go deeper on related hardware metrics, pairing RAM monitoring with CPU temperature tracking gives a fuller picture of system health under load.
Checking RAM usage with PowerShell commands
PowerShell is the fastest route to memory data when you're already in a terminal or want to script recurring checks. These commands work on both Windows 10 and Windows 11.

Check total and free physical memory:
Get-CimInstance Win32_OperatingSystem | Select-Object TotalVisibleMemorySize, FreePhysicalMemory
Output is in kilobytes. Divide by 1,048,576 for GB.
Check RAM usage as a percentage:
$os = Get-CimInstance Win32_OperatingSystem
$used = $os.TotalVisibleMemorySize - $os.FreePhysicalMemory
[math]::Round(($used / $os.TotalVisibleMemorySize) * 100, 2)
This returns a clean percentage, useful for logging or alerting scripts.
List top processes by memory consumption:
Get-Process | Sort-Object WorkingSet64 -Descending | Select-Object -First 10 Name, @{N='RAM (MB)';E={[math]::Round($_.WorkingSet64/1MB,1)}}
This surfaces the ten heaviest processes by Working Set, formatted in MB. It's the PowerShell equivalent of sorting Task Manager's Processes tab by memory, and it's scriptable.
Check installed RAM and speed:
Get-CimInstance Win32_PhysicalMemory | Select-Object Manufacturer, Capacity, Speed, MemoryType
This pulls physical memory details including capacity per stick, speed in MHz, and manufacturer. Useful for confirming what's actually installed versus what the system reports. For users looking to go further with system performance, the Windows 11 debloat guide covers additional ways to free up memory through startup and service optimization.
Tempered makes RAM monitoring work for you, not against you
Knowing how to read Task Manager and Resource Monitor is genuinely useful. But for most Windows users, the real friction isn't finding the data. It's knowing what to do with it. A process consuming 900 MB might be critical or completely disposable, and the tool won't tell you which.
Tempered closes that gap. It's an AI-powered PC optimizer built for Windows 10 and 11 that reads the same live hardware metrics you'd find in Task Manager — RAM, CPU, GPU, disk — and converts them into specific, plain-language recommendations. No technical background needed. Every change it suggests is logged in the Undo Center, so you can reverse anything with one click.

For gamers and everyday users who want their PC running well without spending an afternoon in Resource Monitor, Tempered is the direct path. It handles background process management, startup optimization, and performance tweaks automatically, with the kind of clarity that native Windows tools don't offer. You can also get practical advice on memory management challenges from resources like Techrunners, which covers a broad range of Windows performance topics.
Try Tempered free at tempered.to and see what your system's RAM data is actually telling you.
Key Takeaways
Task Manager's Performance tab gives you an instant RAM snapshot, but hard faults per second in Resource Monitor is the metric that actually signals whether your system is under real memory pressure.
| Point | Details |
|---|---|
| Task Manager for quick checks | Press Ctrl+Shift+Esc, go to Performance > Memory for total RAM, usage, speed, and slots used. |
| Resource Monitor for process-level detail | Sort by Hard Faults/sec to find which process is forcing Windows to page to disk. |
| High usage isn't always a problem | Standby memory is a cache Windows reclaims freely; watch hard faults, not raw percentage. |
| RAMMap for advanced analysis | Free Sysinternals tool that reveals memory states like File-Mapped and Kernel Stack beyond what Task Manager shows. |
| Tempered for plain-language guidance | Translates live RAM metrics into specific recommendations and manages background processes automatically, with one-click Undo. |