
Runtime Broker is a legitimate Windows process, and disabling it will break app permissions, not fix your PC. If it's eating sustained CPU (above roughly 15 to 30%) rather than a brief spike when you open an app, end the task in Task Manager and restart, then turn off Windows tips and switch Spotlight to a static picture. Those two moves resolve most cases without touching a single system file.
TL;DR:
- Turning off Windows tips and switching Spotlight to a static picture can resolve most high CPU issues caused by Runtime Broker without complex fixes.
- Most CPU spikes happen when a specific app from the Microsoft Store triggers Runtime Broker repeatedly, which can be diagnosed by watching resource use while opening apps.
- If CPU usage stays above 30 percent for minutes or memory exceeds 1 GB, it indicates a deeper problem, often with apps or background tasks rather than Runtime Broker itself.
- Updating Windows and Store apps, repairing problematic apps, and limiting background permissions are effective steps before resorting to service tweaks or registry edits.
- Persistent issues may involve corrupted system files, malware, or misbehaving apps, requiring running system scans or using resource monitoring tools to identify the true cause.
Table of Contents
- Quick Fixes for Runtime Broker High CPU Usage
- How Do You Find What's Triggering Runtime Broker?
- Step-by-Step Troubleshooting: From Safe to More Advanced
- When Should You Worry About Runtime Broker?
- Keeping Runtime Broker Behavior Normal Long Term
- What Ian Has Learned Diagnosing Runtime Broker Issues
- What Runtime Broker Actually Does With App Permissions
- Do Windows Updates Cause Runtime Broker CPU Spikes?
- How to Use Resource Monitor for Deeper Runtime Broker Analysis
- What Do Runtime Broker Event Log Entries Mean?
- Managing Notifications and Permissions to Reduce Overhead
- The Real Lesson Buried in Runtime Broker Complaints
- An Easier Way to Catch This Before It Slows You Down
- Sources
- FAQ
Quick Fixes for Runtime Broker High CPU Usage
Try these before anything more involved. Most take under a minute each, and none of them require editing the registry or messing with services.
- Open Task Manager (Ctrl+Shift+Esc), click Runtime Broker, and select End Task. Restart your PC.
- Go to Settings > System > Notifications and turn off "Get tips, tricks, and suggestions as you use Windows."
- Go to Settings > Personalization > Background and switch from Windows Spotlight to Picture.
- Open Settings > Apps and limit background activity for any app you suspect is misbehaving.
- Check Settings > Windows Update and the Microsoft Store for pending updates, then install them.
- Run a quick scan with your antivirus if the spikes started suddenly with no obvious cause.
Windows Spotlight and the built-in tips feature both run through the same permission-checking layer as Store apps, which is why they're such common triggers for repeated Runtime Broker spikes. Turning them off fixes more cases than people expect.
How Do You Find What's Triggering Runtime Broker?
You can't fix what you can't see happening. Open Task Manager and watch the Processes tab while you open apps one at a time, especially anything from the Microsoft Store. If Runtime Broker jumps every time a specific app launches, you've found your culprit.
- Switch to the Details tab for a more granular CPU reading over time.
- Use Process Explorer from Microsoft's Sysinternals suite to inspect handles, parent processes, and loaded modules.
- Right-click Runtime Broker in Process Explorer and choose "Open File Location" to confirm it's running from
C:\Windows\System32. - Toggle Spotlight or notifications off and on while watching CPU to confirm whether they're the trigger.
Pro Tip: Reproduce the spike on purpose. Open the suspected app, wait 30 seconds, close it, and check whether CPU drops back down. If it doesn't drop, the app is holding the process open, not just triggering a brief permission check.
Step-by-Step Troubleshooting: From Safe to More Advanced
Work through these in order. Stop as soon as CPU usage returns to normal. There's no reason to jump to disabling services when a simple restart handles it.
Start here (lowest risk):
- End the Runtime Broker task in Task Manager and restart your PC.
- Install all pending Windows and Microsoft Store updates.
- Disable "Get tips, tricks, and suggestions" and switch Spotlight to Picture.
- Limit background activity and notifications for the specific app you identified during diagnosis.
If the spikes continue:
- Repair the offending UWP app through Settings > Apps > [app name] > Advanced options > Repair. If repairing doesn't help, reset it, and if that fails, uninstall and reinstall it from the Store.
- Perform a clean boot to rule out a third-party service or startup program interfering with Runtime Broker. This starts Windows with a minimal set of drivers and startup programs, so if the spike disappears, you know something outside Windows itself is responsible.
Only after isolating the cause:
- Consider whether SysMain is contributing to disk and CPU contention, and only disable SysMain if you've confirmed it's actually part of the problem on your specific hardware. On a system with an SSD, SysMain rarely helps and occasionally causes background thrashing.
- Double-check Windows Update isn't mid-install, since update-related background tasks can look like a Runtime Broker problem when the real load is elsewhere.
Skip straight to disabling services or editing the registry, and you risk breaking something that has nothing to do with your original problem. Registry edits to disable Runtime Broker outright are not recommended by anyone who understands what the process actually does. Work through the list in order, and you'll almost always solve it before you get anywhere near that territory.
When Should You Worry About Runtime Broker?
Most Runtime Broker activity is nothing. Here's what actually warrants a closer look.
- Sustained CPU above 30% for minutes at a time, not just a burst when an app opens.
- Memory use climbing past 1 GB, well beyond its normal footprint of 20 to 40 MB.
- Multiple Runtime Broker instances running at once in Task Manager.
- Spikes while the PC is idle, with no app open that would explain it.
Normal Runtime Broker CPU load is close to zero outside of brief app-launch checks. That baseline is exactly why sustained 30%+ usage stands out so clearly.
If you see any of these, right-click the process, open its file location, and confirm it's sitting in C:\Windows\System32. If it's running from anywhere else, that's not Runtime Broker. Scan it with your antivirus and upload the file to VirusTotal for a second opinion. Before anything more drastic, run sfc /scannow and DISM /Online /Cleanup-Image /RestoreHealth from an elevated Command Prompt to repair corrupted system files that can make legitimate processes behave strangely. If none of that resolves it, that's the point to contact Microsoft support directly.
Keeping Runtime Broker Behavior Normal Long Term
A little routine maintenance prevents most repeat episodes.
- Keep Windows and Store apps updated; a surprising number of Runtime Broker complaints trace back to one outdated app stuck in a permission loop.
- Uninstall Store apps you no longer use instead of letting them sit and run background checks.
- Revisit app permissions and startup items every few months. What you approved a year ago may not still need to run in the background.
- Run scheduled antivirus scans so a rogue process gets caught early instead of after weeks of unexplained slowdowns.
- If one app keeps causing trouble, find out what's actually driving the CPU load instead of guessing at the fix each time.
What Ian Has Learned Diagnosing Runtime Broker Issues
. Across dozens of reader questions about mysterious CPU spikes, Runtime Broker complaints follow a predictable pattern: something else is broken, and Runtime Broker is just the messenger reporting it.
Tempered approaches this the same way, by identifying the actual background constraint rather than guessing. Every suggested change comes with a plain explanation of what it does and a one-click undo, so nothing happens to your system without your approval.
What Runtime Broker Actually Does With App Permissions
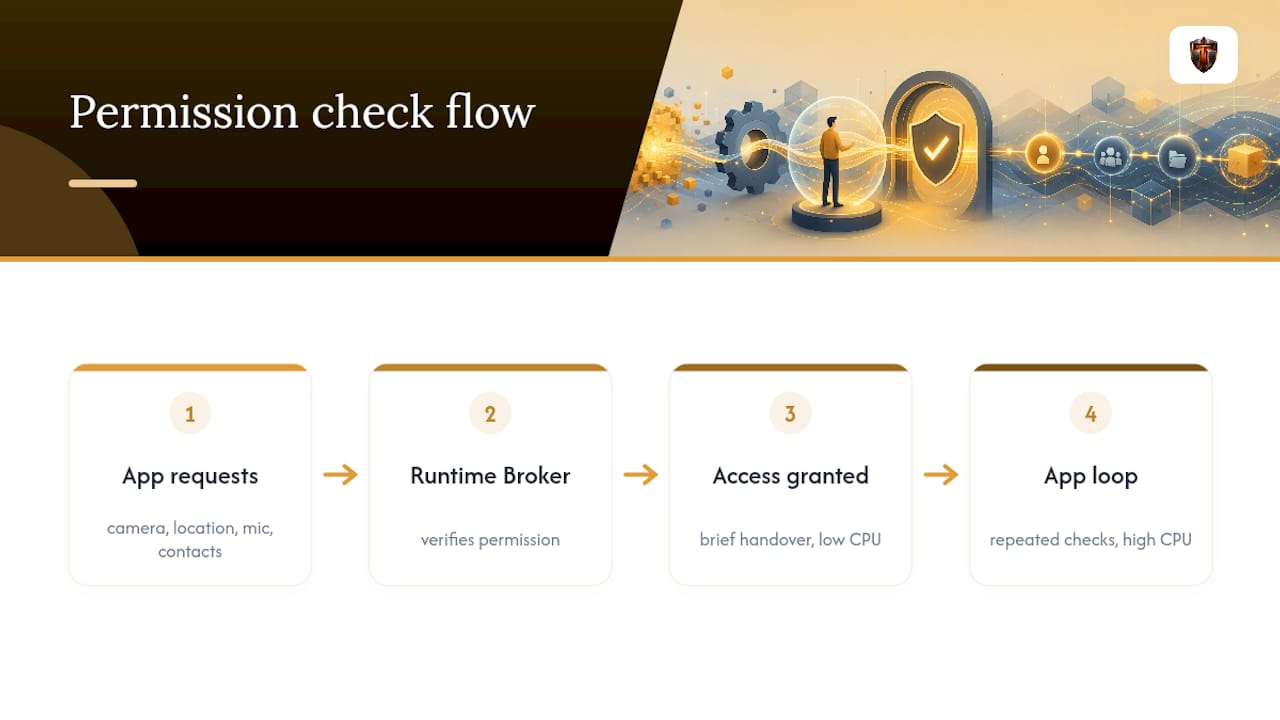
Runtime Broker exists because Microsoft Store apps (UWP apps) don't get free rein over your system the way traditional desktop programs do. Each time one of these apps wants to use your camera, location, microphone, or contacts, Windows needs something to check whether that app actually has permission, and Runtime Broker is that checkpoint.
This checking happens constantly, often without you noticing, because it's supposed to be fast and lightweight. Open the Camera app, and Runtime Broker briefly verifies camera access before handing control over. Close the app, and the process settles back down. That's the normal cycle, and it explains why you'll see Runtime Broker flicker in Task Manager dozens of times a day at negligible CPU cost.
Problems start when an app requests permissions repeatedly instead of once, or gets stuck in a loop asking for access it already has. A poorly coded UWP app, or one with a bug introduced in a recent update, can hammer Runtime Broker with permission checks far more often than it should. The process itself isn't broken. It's doing exactly what it's designed to do, just in response to an app that's misbehaving. This is why the fix almost never involves Runtime Broker directly and almost always involves the app triggering it, whether that means updating it, resetting it, or removing it entirely.
Do Windows Updates Cause Runtime Broker CPU Spikes?
Windows updates cut both ways with Runtime Broker. Sometimes a cumulative update fixes a bug that was causing excess permission checks. Other times, a fresh update introduces a new one, especially in the weeks right after a feature update rolls out broadly.
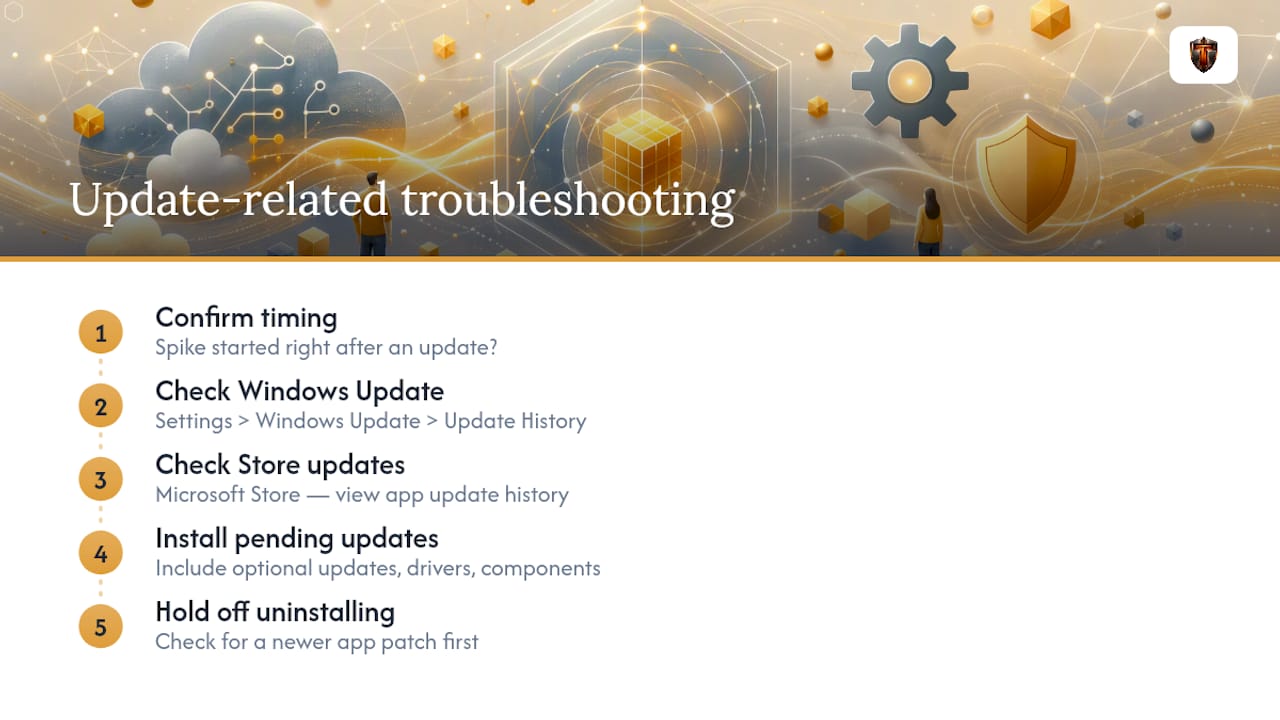
If Runtime Broker spikes started right after your PC installed an update, that timing is a real clue worth following. Check Settings > Windows Update > Update History to see what installed recently, and check the Microsoft Store's own update history for any UWP apps that updated around the same time. Either one could be the source.
The fix here is straightforward: make sure you're not behind. Go to Settings > Windows Update and install anything pending, including optional updates that sometimes carry driver or component fixes Microsoft doesn't push automatically. Do the same in the Microsoft Store by checking for app updates manually rather than waiting for the automatic cycle. If a specific app's update seems to have caused the problem, check whether a further update has already patched the bug before you resort to uninstalling it. Developers often push a fix within days once a bug like this gets reported widely enough.
How to Use Resource Monitor for Deeper Runtime Broker Analysis
Task Manager tells you Runtime Broker is using CPU. Resource Monitor tells you more about what it's doing while it does it. Open it by typing "resmon" into the Start menu search bar, or launch it from the Performance tab in Task Manager.
Under the CPU tab, find Runtime Broker in the process list and expand it to see associated services and handles. The Overview tab also shows disk and network activity tied to the same process, which matters because a permission loop tied to network-dependent features (like sign-in status checks) can show up as CPU load with a network component you'd otherwise miss.
Performance Monitor goes a level deeper, letting you log Runtime Broker's CPU and handle count over time rather than just a snapshot. Set up a Data Collector Set targeting the process, let it run for 20 to 30 minutes during normal use, and you'll get a timeline showing exactly when spikes happen rather than relying on memory of when things felt slow. That timeline is often the fastest way to correlate a spike with a specific app launch, a scheduled task, or a background sync you didn't know was running.
What Do Runtime Broker Event Log Entries Mean?
Windows Event Viewer logs a lot of noise, and Runtime Broker rarely generates entries dramatic enough to explain a CPU spike on its own. Still, checking it is worth the five minutes when other diagnostics come up empty.
Open Event Viewer, navigate to Windows Logs > Application and Windows Logs > System, and filter by time range around when you last saw a spike. Look for Warning or Error entries from sources tied to the Application Model or AppXSvc, since these relate to how UWP apps register and request permissions. An app repeatedly failing a permission handshake will often leave a trail here, even when Task Manager shows nothing more than "Runtime Broker: high CPU."
Don't expect Runtime Broker itself to log much detail. It's a background broker process, not a diagnostic tool, so most of what you learn from Event Viewer comes from the apps around it rather than the process itself. Treat it as a supporting clue that confirms what Task Manager and Resource Monitor already pointed you toward, not a standalone diagnostic path.
Managing Notifications and Permissions to Reduce Overhead
Every notification and every granted permission is a small ongoing checkpoint for Runtime Broker to manage. You don't need to strip your PC down to nothing, but a lighter permission footprint means fewer checks running in the background.
Go through Settings > Apps > Installed Apps periodically and ask whether each Store app still needs the permissions it was granted. Location access for a weather app makes sense. Location access for an app you installed once and never opened again does not. Revoke what you don't use.
Notifications work the same way. Settings > System > Notifications lets you turn off alerts app by app instead of an all-or-nothing switch, so you can keep messaging apps loud while silencing everything else. Fewer active notification channels means fewer permission checks running behind the scenes. Combine that with keeping your app list trimmed to what you actually use, and Runtime Broker has a lot less work to do in the first place.
The Real Lesson Buried in Runtime Broker Complaints
The conventional advice treats Runtime Broker like a mystery to be solved with a magic registry tweak. It isn't. It's a permission checkpoint, and when it's loud, something else is asking it too many questions. Most guides skip straight to "here are 10 things to try" without explaining that distinction, which is why so many people end up disabling services that had nothing to do with their actual problem.
What the evidence actually supports is a narrower path: identify the app or feature triggering the spike, then fix that specific thing. Windows Spotlight and Windows tips cause a disproportionate share of complaints for how minor they are, which tells you something about how often people skip the two-minute settings check before reaching for more drastic measures.
Where I'd push back on the usual advice is the instinct to jump to service tweaks or clean installations. Those are real tools, but they're last resorts, not step two. A tool designed for this purpose fits well here precisely because it does the identification work for you and explains its reasoning, rather than asking you to guess which of a dozen possible causes applies to your machine.
— Ian
An Easier Way to Catch This Before It Slows You Down
Some performance optimization tools are built for exactly this kind of problem: a background process quietly eating resources for reasons that aren't obvious from Task Manager alone. Instead of digging through Process Explorer and Event Viewer yourself, these tools scan your live hardware metrics, CPU, RAM, disk, and uptime, and flag the actual constraint behind a slowdown in plain language.

Some PC optimizers stand apart from generic PC cleaners by offering transparency. Every recommendation comes with a clear explanation of what it changes and why, plus a one-click undo, so you're never left wondering what a tool did to your system. That matters most for readers dealing with a recurring, unclear CPU issue that survives a restart and a settings check.
If manual troubleshooting hasn't fully solved your Runtime Broker problem, or you'd rather have a running diagnostic keeping watch instead of checking Task Manager every time something feels slow, try Tempered's free tier and run a scan to see what's actually driving your system's behavior.
Sources
For deeper technical detail, see Microsoft's official Runtime Broker guidance and HowToGeek's process breakdown.
- What Is 'Runtime Broker' and Why Is It Running on My PC?
- Runtime Broker is using too much memory - Microsoft Support
- What Is Windows Runtime Broker? Here's Why It's Spiking Your CPU Usage
FAQ
Can I Disable Runtime Broker?
You can end its task temporarily in Task Manager, but you shouldn't disable it permanently. It's a core Windows process that manages app permissions, and disabling it through the registry can break how Store apps request access to your camera, location, and other features.
Do I Need Runtime Broker on My Computer?
Yes, if you use any Microsoft Store (UWP) apps. It's the mechanism Windows uses to check and enforce app permissions, and it's been part of Windows since Windows 8.
Is Runtime Broker Safe?
Yes, the legitimate version running from C:\Windows\System32 is a normal, safe Windows process. If you find it running from a different folder, that's a red flag worth scanning with antivirus software or checking against VirusTotal.
Why Is 90% of My CPU Being Used?
Usage that high usually points to a specific misbehaving app, a corrupted system file, or malware disguised as a legitimate process, rather than Runtime Broker itself. Check Task Manager for which process is actually driving the load, and run sfc /scannow to rule out file corruption before assuming it's a permanent problem.