A high hotspot number alone doesn't mean your GPU is in danger. What matters is the gap between hotspot and core temperature, and whether the card is throttling. If that gap stays under roughly 15°C and clocks hold steady, you're fine. If it's climbing past 20°C or the hotspot is parking near 105 to 110°C. Stop gaming and run a logged test with a tool that actually reports both numbers.
TL;DR:
- A hotspot temperature near 105 to 110°C with a delta above 20°C indicates potential overheating and possible throttling; stop gaming and log detailed metrics.
- The crucial factor is the temperature difference between hotspot and core, ideally around 10 to 15°C; larger gaps typically signal thermal contact issues.
- Limited visibility of hotspot data in newer GPUs, especially the RTX 50 series, can create diagnostic blind spots, so alternative tools or internal Nvidia software may be necessary.
- Proper logging of core, hotspot, power draw, fan speeds, and room temperature over a 20-minute load test is essential to accurately diagnose localized thermal problems.
- Resolving high hotspot delta issues often starts with airflow optimization and basic software tweaks, followed by reseating or repasting if those steps fail.
Table of Contents
- Gpu Hotspot Temperature Explained: Junction Vs Core
- What Counts As A Safe Hotspot Delta
- What Actually Drives A High Hotspot Delta
- How To Log Hotspot Readings Correctly
- Fixing A High Hotspot: From Free Tweaks To Repaste
- When A High Hotspot Means It's Time For Repair Or RMA
- How A Diagnostics-First Tool Approaches A Hotspot Problem
- Author Perspective: Judge The Trend, Not The Panic Number
- A Guided Way To Catch Thermal Problems Before They Escalate
- Tools And Reports Worth Bookmarking
- Sources
- FAQ
Gpu Hotspot Temperature Explained: Junction Vs Core
The number most monitoring software calls "GPU temperature" is really an average pulled from sensors spread across the die. The hotspot, also called the junction temperature, is different. It's the single hottest point on the entire GPU die at any given moment, not an average.
Think of it like a griddle. The core or "edge" temperature is what a thermometer laid flat across the whole surface would read. The hotspot is what you'd get if you touched the one spot right above the burner. Modern GPU dies aren't uniform. Some areas handle more current, some sit closer to VRAM, and some are simply farther from the cooler's contact point. Averaging hides all of that. The hotspot sensor exists specifically because engineers didn't want a dangerously hot local spot masked by a comfortable overall average.
This is why the delta between the two readings matters more than either number in isolation. A card running a core temp of 70°C with a hotspot of 100°C has a real problem, even though 70°C looks perfectly calm on a basic overlay.
There's a wrinkle worth knowing about heading into 2026: sensor visibility isn't consistent across GPU generations. Some newer Nvidia RTX 50 series (Blackwell) cards had their hotspot data blocked from standard Windows monitoring APIs entirely, meaning tools that used to show the reading suddenly stopped. Investigators found the physical sensor was still there and readable, just not exposed to the software most people used to check it, which created a genuine diagnostic blind spot for owners trying to troubleshoot overheating. If your monitoring tool suddenly shows no hotspot field where it used to, that's not your card being fine. It's a data access problem.
What Counts As A Safe Hotspot Delta
The absolute hotspot number is less useful than the gap between it and core temperature. A hotspot in the high 80s or low 90s Celsius can be completely normal, as long as the delta between hotspot and core stays in the typical range.
The rule of thumb that hardware reviewers and repair techs rely on: a healthy delta runs about 10 to 15°C above core temperature. A GPU idling at 45°C core with a 58°C hotspot is unremarkable. A card gaming at 70°C core with an 84°C hotspot is also unremarkable, because the gap is proportional.
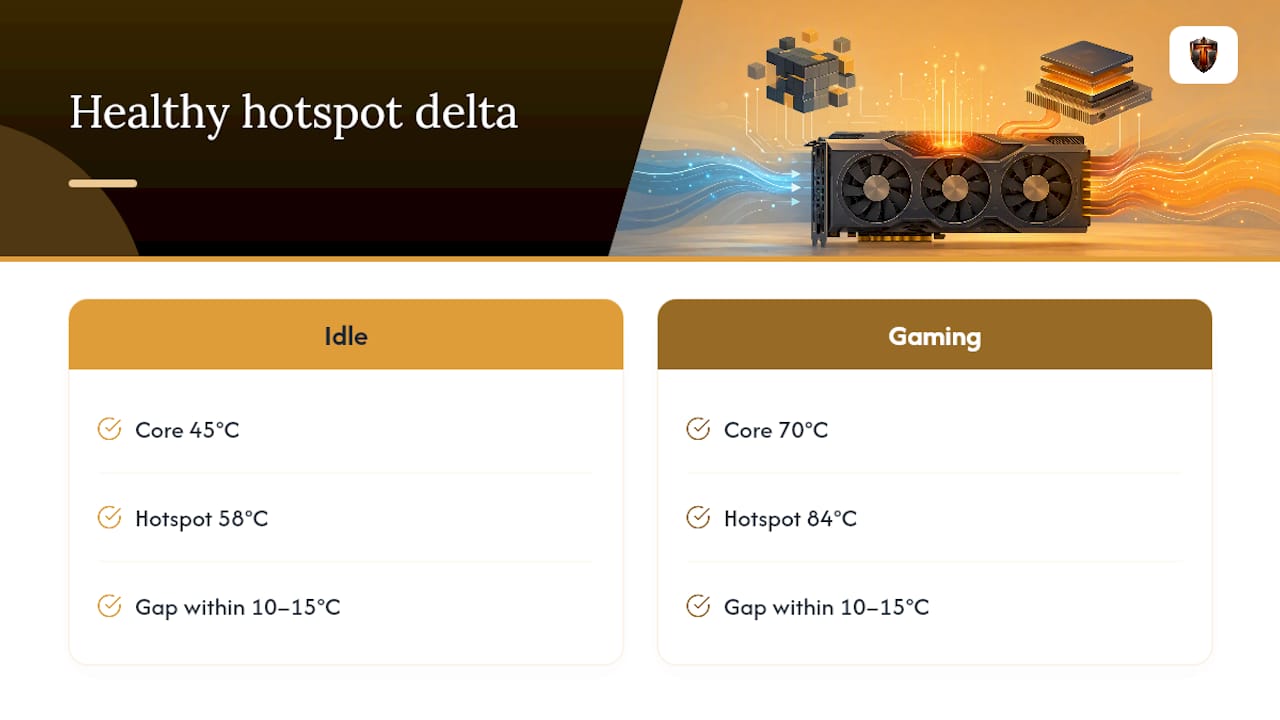
The trouble starts when that gap widens significantly above normal levels and stays there under load. That's commonly a sign of a contact or thermal interface problem, not a card that's simply working hard.
Absolute thresholds still matter at the extreme end. Most modern GPUs begin throttling clocks near high temperature limits, and if the card hits a hard limit, it will cut performance abruptly or shut down to protect itself. During a sustained session, watch for clock speeds dropping while fan speed pegs at 100 percent and the hotspot number refuses to come back down. That combination, not any single reading, is what tells you the card is fighting to keep itself alive rather than just running warm.
What Actually Drives A High Hotspot Delta
A widening delta almost always traces back to how heat physically moves off the die, not to the silicon itself being defective. Here's what typically causes it:
- Thermal paste pump-out or uneven spread. Over months of thermal cycling, factory paste can migrate away from the hottest zone of the die, leaving a thin or dry patch exactly where you don't want one.
- Uneven mounting pressure. If a cooler or waterblock isn't seated evenly, one corner of the die gets excellent contact and another barely touches the cold plate at all. That imbalance shows up as a localized hotspot with a calm average temperature everywhere else.
- Aged or mismatched thermal pads. Pads covering VRAM and memory modules degrade or compress over time, and a pad that's the wrong thickness for a given board revision leaves a gap that heat has to fight through.
- Poor case airflow or high ambient temperature. A GPU can have flawless internal contact and still run a wide delta if it's starving for fresh air, recirculating its own exhaust, or sitting in a room that's 30°C in summer.
- Excessive power draw or a marginal PSU cable. More watts through the die means more heat concentrated at the same physical points, and a loose or degraded power connector can add resistance that shows up as extra localized heat right at the connector-adjacent VRM section.
Pro Tip: Before you touch a single screw, isolate whether the problem is airflow or contact. Drop the power limit 10 to 15 percent in your GPU control panel and re-run the same test. If the delta shrinks noticeably, power draw is a major contributor. If it barely moves, you're looking at a physical contact problem.
How To Log Hotspot Readings Correctly
You can't fix what you haven't measured properly, and a single screenshot mid-game tells you almost nothing. What you need is a short, repeatable log that captures both hotspot and core over time, alongside the variables that explain them.
Four utilities cover nearly every diagnostic need here: HWiNFO, HWMonitor, GPU-Z, and AIDA64. HWiNFO is the deepest of the four and its sensor panel plus logging-to-file feature makes it the strongest choice for building an evidence trail. GPU-Z is lighter and faster to open for a quick sanity check. AIDA64 pairs well with its own built-in stress test if you want load and monitoring in one window. HWMonitor is a solid backup, and it's notably one of the tools that reintroduced hotspot readings on affected cards after the initial blocking issue.
The caveat that trips people up: on some newer cards, different utilities may pull hotspot data from different candidate sensors, and the numbers won't always agree exactly. Developers working on this problem have noted that multiple sensor registers can look plausible as the "real" hotspot value, so cross-checking two tools against each other is smarter than trusting one blindly. If your card's hotspot field reads suspiciously flat or identical to core temp, that's usually a sign the software fell back to an averaged value rather than the true junction sensor.
Here's the test worth running before you decide anything else:
- Baseline idle capture. Let the PC sit at desktop for 10 minutes, then screenshot HWiNFO's sensor panel showing core, hotspot, fan RPM, and clock speed.
- Load the GPU for 20 minutes. Use a game you know is GPU-bound or a benchmark like AIDA64's built-in GPU stress test. Twenty minutes is long enough to separate a brief spike from a genuine sustained climb, per monitoring guidance from GPU thermal specialists.
- Enable logging to file in HWiNFO before you start, rather than relying on memory or screenshots taken mid-run.
- Record ambient room temperature at the same time, since a 28°C room versus a 20°C room can shift every number by several degrees.
- Compute the delta afterward: max hotspot minus max core, and separately, average hotspot minus average core during the sustained middle portion of the run.
What you want logged, at minimum:
| Metric | Why it matters |
|---|---|
| Core (edge) temperature | Your baseline for computing delta |
| Hotspot (junction) temperature | The number that reveals localized problems |
| GPU power draw (W) | Confirms whether heat load matches expectations |
| Fan RPM | Shows whether the cooler is responding correctly |
| Clock speed | Drops here confirm throttling is happening |
| Ambient room temperature | Normalizes the test for comparison later |
A brief spike to 95°C for two seconds during a loading screen isn't the same problem as a hotspot that climbs to 95°C and sits there for the full 20 minutes. The first is noise. The second is your evidence.
Fixing A High Hotspot: From Free Tweaks To Repaste
Start with what costs nothing and takes ten minutes, then work up to what requires a screwdriver.
Software and airflow, first:
- Adjust the fan curve so fans ramp harder before the hotspot climbs, rather than reacting after it's already elevated.
- Clean dust from intake fans, radiator fins, and the GPU's own heatsink. Dust buildup on a card that's been running two or three years can meaningfully choke airflow on its own.
- Check case intake and exhaust balance. A case pulling in less air than it exhausts runs slightly negative pressure and pulls dust and warm air through every gap.
- Drop the power limit 5 to 15 percent, or apply a mild undervolt through your GPU vendor's software. If this alone tightens the delta, you've found your answer without opening the case.
If none of that moves the needle and the delta stays wide, it's time to go hands-on:
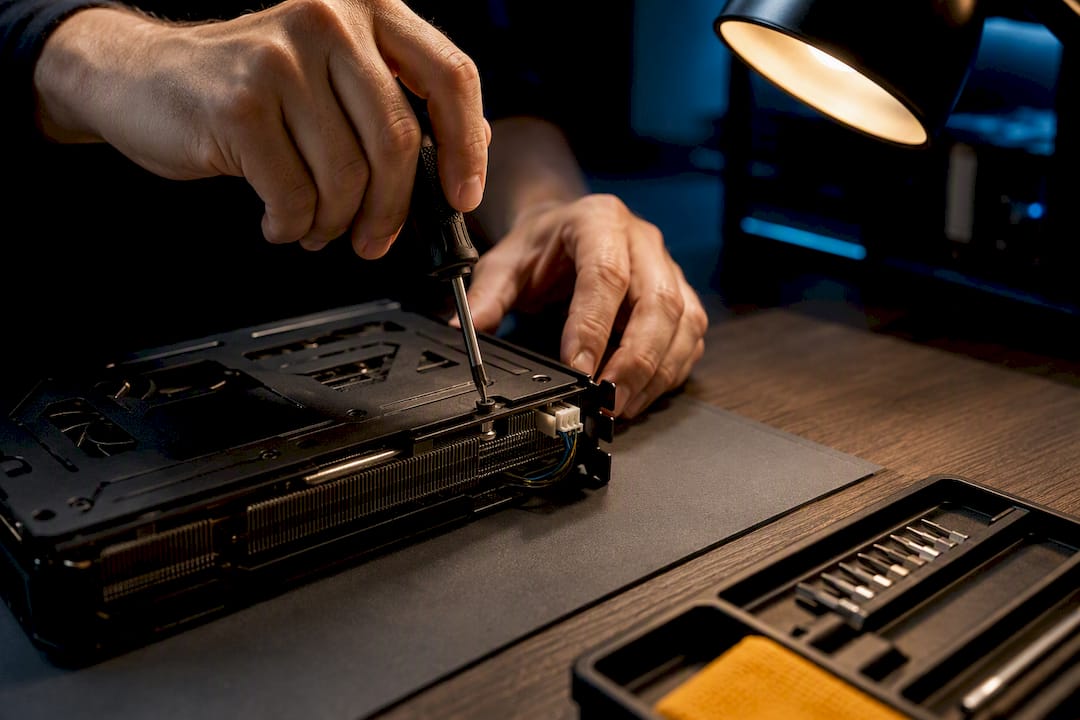
- Reseat the cooler and repaste. Remove the cooler, clean off the old paste completely, and apply a fresh line or X pattern of a quality non-conductive thermal compound. Tighten the mounting screws in a cross pattern (opposite corners, alternating) rather than one side at a time, so pressure distributes evenly across the die instead of tilting it.
- Replace thermal pads on VRAM and VRM if the card is a few years old or if pads look compressed and crumbly when you remove the cooler.
- Re-run the exact same 20-minute test you logged before. The only way to confirm the fix worked is comparing the new delta against your baseline. A repaste job on a card that previously showed a gap over 20°C should bring that number back down toward the 10 to 15°C range.
Pro Tip: Don't skip the "before" log. Reviewers who've documented repaste cases consistently use delta reduction, not a gut feeling, as proof the fix actually worked. Without a baseline, you're guessing whether the paste job helped or you just got lucky with a cooler room that day.
Know when to stop. If the card is still under warranty, opening the cooler yourself can void that warranty depending on the manufacturer. If you're not comfortable removing a cooler shroud without damaging fan cables or a backplate, that's a legitimate reason to send it to a professional instead. Document your logged evidence, including timestamps, before you open anything, so you have a record either for your own reference or to hand to a repair shop.
When A High Hotspot Means It's Time For Repair Or RMA
A handful of signals mean it's time to stop using the card and get it looked at rather than keep tweaking software settings.
Repeated throttling while core temperature stays moderate is the clearest red flag. If clocks are dropping and fans are maxed while your core reading says 70°C, the card believes it's overheating even though the tool you're watching doesn't show why. A hotspot that repeatedly parks at or near its throttle limit, session after session, points to the same underlying contact problem rather than a one-off bad run. Physical signs matter too: any burning smell, visible discoloration near VRM components, or a coil whine that's gotten noticeably louder are reasons to stop immediately, not keep testing.
For support tickets or RMA claims, bring your logged data: timestamped hotspot and core readings, ambient temperature, power draw during the test, and a plain list of what you already tried. Vendors have their own internal diagnostic tools, similar to the MODS utility that surfaced a 107°C hotspot reading on a card that public software showed running a calm 68°C. Their internal numbers may not match what you saw at home, and that's expected, not a sign your data was wrong.
How A Diagnostics-First Tool Approaches A Hotspot Problem
A sound diagnostic process for any thermal issue follows the same shape regardless of what tool runs it: measure the actual numbers, compare them against what's expected for that hardware, propose one specific change, then verify the change worked before moving to the next one.
Tempered applies that same logic to overall PC performance issues, including thermal ones. It reads live hardware metrics such as CPU, RAM, GPU, and uptime data, flags a real constraint instead of guessing, and proposes a specific, user-approved change with a plain-language explanation of what it expects to happen. Every adjustment comes with a one-click undo path, so nothing gets changed on your system without your sign-off first.
The data points worth collecting for any GPU thermal issue mirror what a diagnostics tool should track: hotspot and core temperature, power draw, fan RPM, driver version, and timestamps. For readers who want to go deeper on the airflow and power side of the equation, Tempered's guide on lowering GPU temperature walks through the settings-level changes that often move the needle before any hardware repair is necessary.
Author Perspective: Judge The Trend, Not The Panic Number
Most people who post a scary hotspot screenshot online are reacting to one number pulled from one moment. That's the wrong instinct. Log first. A single 98°C reading during a loading screen means nothing next to a 98°C reading that holds steady for fifteen minutes while your fans scream and your frame rate drops.
Try the free fixes before the destructive ones. Airflow and power limit changes cost you nothing and take less time than removing a cooler. Reseating and repasting should come after your logs prove a persistent delta problem, not before.
And if you're heading toward an RMA, document everything while the card is still assembled. Once you've opened it, you've likely lost the cleanest evidence you had.
— Ian
A Guided Way To Catch Thermal Problems Before They Escalate
Running your own 20-minute logging test and cross-checking three monitoring tools works, but it takes time most people don't want to spend every time their fans get loud. Tempered gives you a faster path to the same answer: it reads your system's live metrics, tells you in plain language what's actually constraining performance, and shows you exactly what it wants to change and why before it touches anything.
Every suggested tweak comes with an undo path, so if a change doesn't help your thermal numbers, reverting takes one click. That fits directly into the measure, diagnose, apply, verify loop that any solid thermal troubleshooting process depends on. The Free tier lets you run an initial scan to see what it finds on your own machine, and the Torque plan starting at $5.99 per month unlocks unlimited scans if you want ongoing monitoring rather than a one-time check. Head to the pricing page and run a scan to see what it flags on your setup.
Tools And Reports Worth Bookmarking
For readers who want to dig into primary sources rather than take troubleshooting advice at face value, a few references stand out. PCGamer's reporting on the blocked RTX 50 series hotspot sensors explains how the visibility issue was discovered. TechPowerUp's coverage of the MODS diagnostic tool and repaste case walks through a real repair scenario start to finish. For the monitoring software itself, HWiNFO, GPU-Z, and AIDA64 all remain free downloads worth having installed before you ever need them, and Tempered's own guide to monitoring PC temperatures covers setup basics for readers newer to logging tools.
Sources
- Too hot to handle: a leaked internal Nvidia tool re-enables blocked GPU hotspot sensor data for RTX 50 series
- NVIDIA GeForce RTX 50 Series Hotspot Sensor Can Be Accessed with NVIDIA's Internal Tool | TechPowerUp
- There’s one sensor on your RTX GPU that Nvidia doesn’t want you to see, and the reason for it is a big mystery
- GPU Hotspot Temp Safe Range: What Is Normal in 2026?
FAQ
What's a safe GPU hotspot temperature?
A hotspot in the 80s to low 90s Celsius under sustained load is typically safe, as long as the delta between hotspot and core temperature stays around 10 to 15°C. The absolute number matters less than whether that gap is proportional and whether clocks are holding steady rather than throttling.
Is a 90°C hotspot safe for GPUs?
It depends entirely on the delta, not the raw number. A 90°C hotspot with a core temperature about 10 to 15°C lower is a normal gap and nothing to worry about, but a 90°C hotspot sitting next to a core far below that typical range indicates a large delta pointing to a contact or thermal paste problem worth investigating.
Should I look at GPU temperature or GPU hotspot temperature?
Look at both together, since neither number alone tells the full story. Core temperature shows the overall thermal state of the die, while hotspot shows the single hottest point, and the gap between the two is what actually reveals whether your cooling contact is working correctly.
Is it normal for the GPU hotspot to be over 100 degrees Celsius?
It can be normal under heavy sustained load if the delta to core temperature stays reasonable and clocks aren't dropping, but a hotspot sustained at or above 105 to 110°C usually means the card is at or near its throttle point. If you can't confirm the delta because your monitoring tool shows no hotspot field, that may be a sensor visibility issue rather than a card running cool.