The fastest way to check your PC temperatures right now is to run a lightweight sensor utility or let Tempered's AI diagnostic scan do it for you. If you want instant readings with no interpretation required, open a tool like HWMonitor or Core Temp and look at your CPU package temp and GPU temp within seconds. If you want safe, reversible recommendations on top of those readings, run Tempered instead. It reads live CPU, GPU, RAM, and disk metrics, then tells you in plain language what to do next. One key concept worth knowing before you dig in: TJMax, the maximum safe junction temperature defined in your processor's datasheet. That number, not a generic online rule, is your real ceiling.
Table of Contents
- How do you monitor PC temps right now?
- How to build a reliable temperature baseline
- What do the numbers actually mean?
- Quick, reversible fixes to try first
- How does AI-assisted monitoring actually help?
- Which monitoring tool is right for you?
- Using predictive analytics for temperature optimization
- How often should you update your temperature baseline?
- How does room temperature affect your PC temps?
- Key Takeaways
- The case for AI-first monitoring over manual checks
- Tempered gives you live temps, AI diagnostics, and one-click Undo
How do you monitor PC temps right now?
Three practical paths exist, and the right one depends on how much you want to do yourself.
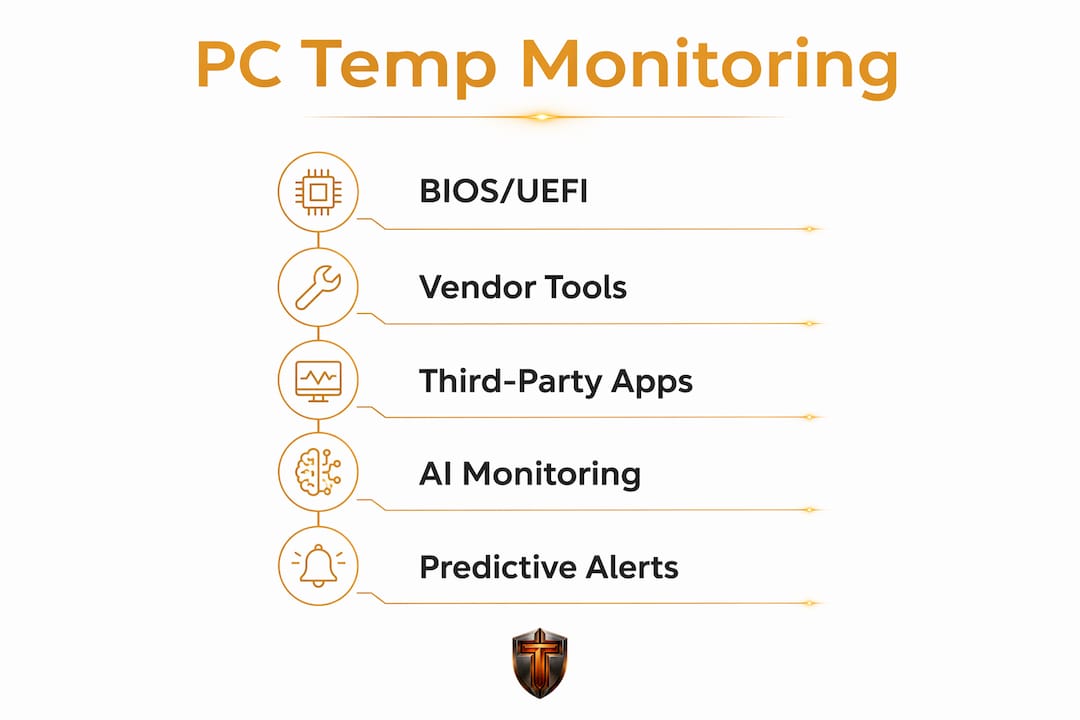
Built-in checks and BIOS/UEFI give you a temperature snapshot, but only at boot, before Windows loads. Useful for a sanity check, not for catching a problem under gaming load.
Manufacturer and motherboard vendor utilities are a low-friction first step. They integrate directly with board sensors and firmware controls, and many include basic fan-speed adjustment. The catch: they often work only with that vendor's hardware, and feature depth varies widely. Vendor-provided utilities are a solid starting point before you install anything third-party.

Lightweight third-party sensor tools are where most users land. HWMonitor reads voltages, temperatures, fan speeds, and SSD health via S.M.A.R.T. across a broad range of hardware. Core Temp focuses on per-core processor temps using the Digital Thermal Sensor built into every modern Intel, AMD, and VIA chip. Open Hardware Monitor covers motherboard sensors, GPU temps, and fan speeds across many boards. LibreHardwareMonitor, a maintained fork, adds NVMe and network card support.
| Approach | Ease of use | Data depth | Logging | System impact |
|---|---|---|---|---|
| BIOS/UEFI | Easy | Low (boot only) | None | None |
| Vendor utility | Easy | Medium | Basic | Low |
| Lightweight sensor tool | Moderate | High | Manual export | Very low |
| AI diagnostic (Tempered) | Very easy | High + context | Automatic | Low |
Pro Tip: If you have a system with both integrated and discrete GPUs, pin the specific GPU in your monitoring tool. Without pinning, readings may auto-switch between GPUs and give you confusing or misleading data.
How to build a reliable temperature baseline
A single temperature reading tells you almost nothing. What matters is a baseline across three conditions: idle, light load, and heavy load. Measuring under all three scenarios is the standard practice for getting data you can actually act on.
- Prepare your environment. Close all non-essential apps. Note the ambient room temperature (more on why that matters in a later section). Let the PC sit at the desktop for five minutes.
- Record idle temps. Note CPU package temp, per-core temps, GPU package temp, VRAM temp, and SSD/NVMe temp. Write them down or screenshot them.
- Run a light task. Open a browser with several tabs, stream a video, or run a document export. Record the same sensors after five minutes of sustained use.
- Run a heavy-load test. Launch a demanding game or a CPU stress tool for 15–20 minutes. Record CPU package and per-core temps, GPU package and hotspot, VRAM, SSD, and fan RPM. If your tool shows CPU package power, log that too.
- Stop if temps spike hard. If CPU temps hit your processor's TJMax or GPU temps exceed 100°C, stop immediately. Check your processor's datasheet for its specific TJMax before you interpret any heavy-load number.
Safety note: Some high-performance processors are engineered to run near 100°C under load. Always check the manufacturer's datasheet for your specific chip's TJMax rather than relying on a generic number you found online.
What do the numbers actually mean?
Safe temperature ranges vary by chip, but industry guidance gives you a working framework.
| Condition | CPU temp | GPU temp | Action |
|---|---|---|---|
| Idle | Below roughly 50°C | Below roughly 50°C | Normal |
| Light load | 50°C–75°C | 50°C–75°C | Normal |
| Heavy load | 75°C–85°C | 75°C–85°C | Monitor closely |
| Sustained temperatures above a high threshold | Above 80–85°C (or your chip's TJMax) | Above 80–85°C (or your GPU's design max) | Act now |
Idle temps below roughly 50°C are generally fine; sustained temps above 80–85°C under load often signal a problem. That said, some high-end processors are built to run closer to 100°C, so TJMax from the manufacturer's datasheet always wins over a generic table.
Thermal throttling is the system's self-defense mechanism, and it shows up in specific ways:
- Sudden FPS drops mid-game with no GPU load change
- CPU or GPU clock speeds dropping while the workload stays constant
- Stuttering that clears up after a few seconds of lighter use
- High package power readings paired with falling clock frequencies
If you see any of those patterns, your chip is already throttling. That is not a warning sign. It is confirmation the problem is real and needs fixing now.
Quick, reversible fixes to try first
Work through these in order. Every step here is reversible before you touch anything permanent.
- Kill heavy background processes. Open Task Manager, sort by CPU and GPU usage, and end anything you do not need. Removing unnecessary background processes is the single fastest way to drop temps without touching hardware.
- Switch your power plan. Change from High Performance to Balanced in Windows power settings. This alone can drop idle and light-load temps noticeably.
- Enable Game Mode. Windows Game Mode reduces background activity during gaming sessions. Tempered's Game Mode does the same with one click and logs the change so you can undo it.
- Reduce graphics settings temporarily. Drop resolution or detail level in your game to confirm whether GPU temps fall. If they do, you have found your ceiling.
- Improve airflow. For desktops, move the case away from walls and clear any blocked vents. For laptops, use a cooling pad or elevate the rear.
- Clean dust filters. Clogged filters are the most common cause of gradual temperature creep. Compressed air and five minutes fix it.
- Check fan headers and speeds. Confirm fans are spinning at expected RPM in your monitoring tool. A dead fan is easy to miss without a sensor readout.
Pro Tip: Undervolting your CPU or applying a conservative power limit gives meaningful temperature relief without permanent changes. If you use Tempered, its Undo Center logs every change so you can roll back with one click if anything feels off.
How does AI-assisted monitoring actually help?
Manual monitoring gives you a snapshot. AI monitoring gives you a pattern. The difference matters when a problem develops gradually over weeks.
AI diagnostic tools add value in a few specific ways:
- Pattern detection across long-term logs. A single high reading is noise. A trend of temps rising 3°C per week over a month is a signal worth acting on.
- Predictive alerts before throttling hits. Instead of noticing a problem mid-game, you get a warning when the trend suggests trouble is coming.
- Plain-language explanations. Instead of a raw number, you get "your CPU is running 12°C hotter than your baseline under the same workload."
- Automated, reversible optimizations. Changes are applied with a log entry, so you can undo them without remembering what you changed.
Most monitoring tools lack native long-term logging; users who need multi-week trend detection must export data manually or use a service that retains and analyzes history automatically. For non-technical users, that gap is where AI tools earn their keep.
Which monitoring tool is right for you?
Run through this checklist before you decide:
- Do you need long-term logs and trend alerts? A lightweight sensor tool alone will not cover you.
- Do you want one-click rollbacks on any change you make? Look for an Undo Center or equivalent.
- Are you comfortable manually tweaking voltages and power limits? If not, an AI-assisted tool is safer.
- Do you need cross-component visibility (CPU, GPU, SSD, RAM in one view)? Confirm the tool covers all four.
- Does system overhead matter? All the tools mentioned here are low-impact, but verify before installing.
Casual users who just want to know if their PC is running hot: Core Temp or HWMonitor, plus Tempered for recommendations. Gamers who need real-time GPU hotspot data and per-session logs: add RigStats or Tempered's live telemetry. Content creators running long renders: long-term logging is non-negotiable, which points toward an AI service or a tool with export capability.
Simplified, purpose-built tools reduce cognitive load for casual users and are preferable to complex utilities when the goal is clear thermal information, not a full hardware audit.
Using predictive analytics for temperature optimization
Predictive analytics in PC monitoring works by establishing your personal baseline across idle, light, and heavy-load conditions, then flagging deviations before they become failures. A tool that only shows current temps reacts to problems. One that tracks trends over time prevents them.
Tempered's AI diagnostic layer does exactly this: it analyzes live CPU, GPU, RAM, and disk metrics continuously, compares them against your historical baseline, and surfaces recommendations when something drifts. Because every recommendation comes with a one-click Undo, you can apply a suggested change, monitor the effect, and reverse it if the result is not what you expected. That feedback loop is what separates predictive optimization from guesswork.
How often should you update your temperature baseline?
Check temps actively any time you notice performance changes, after a hardware upgrade, after a major Windows update, or after cleaning your PC. For ongoing health, a monthly passive check during a gaming session or render is enough for most users.
Update your full baseline (idle, light, heavy) in four situations: after adding or replacing a CPU cooler, after reapplying thermal paste, after a significant ambient temperature change (summer to winter, for example), or after a driver update that changes power behavior. A baseline that is six months old during a heat wave is not a useful reference.
How does room temperature affect your PC temps?
Ambient room temperature directly raises CPU and GPU temps proportionally. A PC running at 75°C under load in a 68°F room will run noticeably hotter in a 90°F room under the same workload, because the cooler's ability to shed heat depends on the temperature difference between the heatsink and the surrounding air.
Record room temperature every time you run a baseline test. Without that note, a reading of 82°C in July looks alarming next to a reading of 74°C in January, even if the PC is in identical health. If your room regularly exceeds 80°F in summer, adjust your alert thresholds upward by a few degrees and factor that into your interpretation. For users in hot climates or poorly ventilated rooms, a motherboard repair or hardware inspection may be worth considering if temps remain elevated even after airflow improvements.
Key Takeaways
Keeping CPU temps below 85°C under sustained load (unless your processor's TJMax is higher), building a three-condition baseline, and using reversible fixes first covers the vast majority of overheating issues in PCs.
| Point | Details |
|---|---|
| Check temps under three conditions | Idle, light load (50°C–75°C), and heavy load (75°C–85°C); a single reading is not enough. |
| Use TJMax, not generic rules | Always check your processor's datasheet for its specific maximum safe temperature before acting. |
| Reversible fixes first | Kill background processes, adjust power plans, and improve airflow before touching hardware or voltages. |
| Room temperature matters | Record ambient temp with every baseline test; a hot room raises all readings proportionally. |
| Tempered for AI-assisted monitoring | Tempered analyzes live metrics, flags trends before throttling hits, and logs every change with one-click Undo. |
The case for AI-first monitoring over manual checks
Most PC users who run into thermal problems did not miss a reading. They missed a trend. A temperature that climbs 2°C per month over six months looks fine in any single session. By the time it causes stuttering or throttling, the underlying cause has been building for a long time.
Manual monitoring with a lightweight sensor tool is genuinely useful for a snapshot. What it cannot do is tell you that your CPU has been running 8°C hotter than your baseline for the past three weeks, or that your GPU hotspot is trending upward after a driver update. That kind of pattern detection requires retained history and something to compare it against.
The other thing manual monitoring cannot do is make a change and automatically log it so you can undo it. Every time I see a guide recommend undervolting or power-limit adjustments, the advice stops at "apply the change." What happens if the change causes instability? What if you forget what you changed three weeks later? An Undo Center solves that problem completely, and it is the feature most users do not know they need until they need it.
For non-technical users especially, the combination of plain-language explanations, predictive alerts, and one-click rollbacks is not a luxury. It is the difference between catching a problem early and replacing hardware that did not need replacing.
Tempered gives you live temps, AI diagnostics, and one-click Undo
Most users who want to monitor CPU and GPU temps end up with a raw number and no clear next step. Tempered closes that gap. It reads live CPU, GPU, RAM, and disk metrics in real time, compares them against your personal baseline, and tells you in plain language what to fix and why.
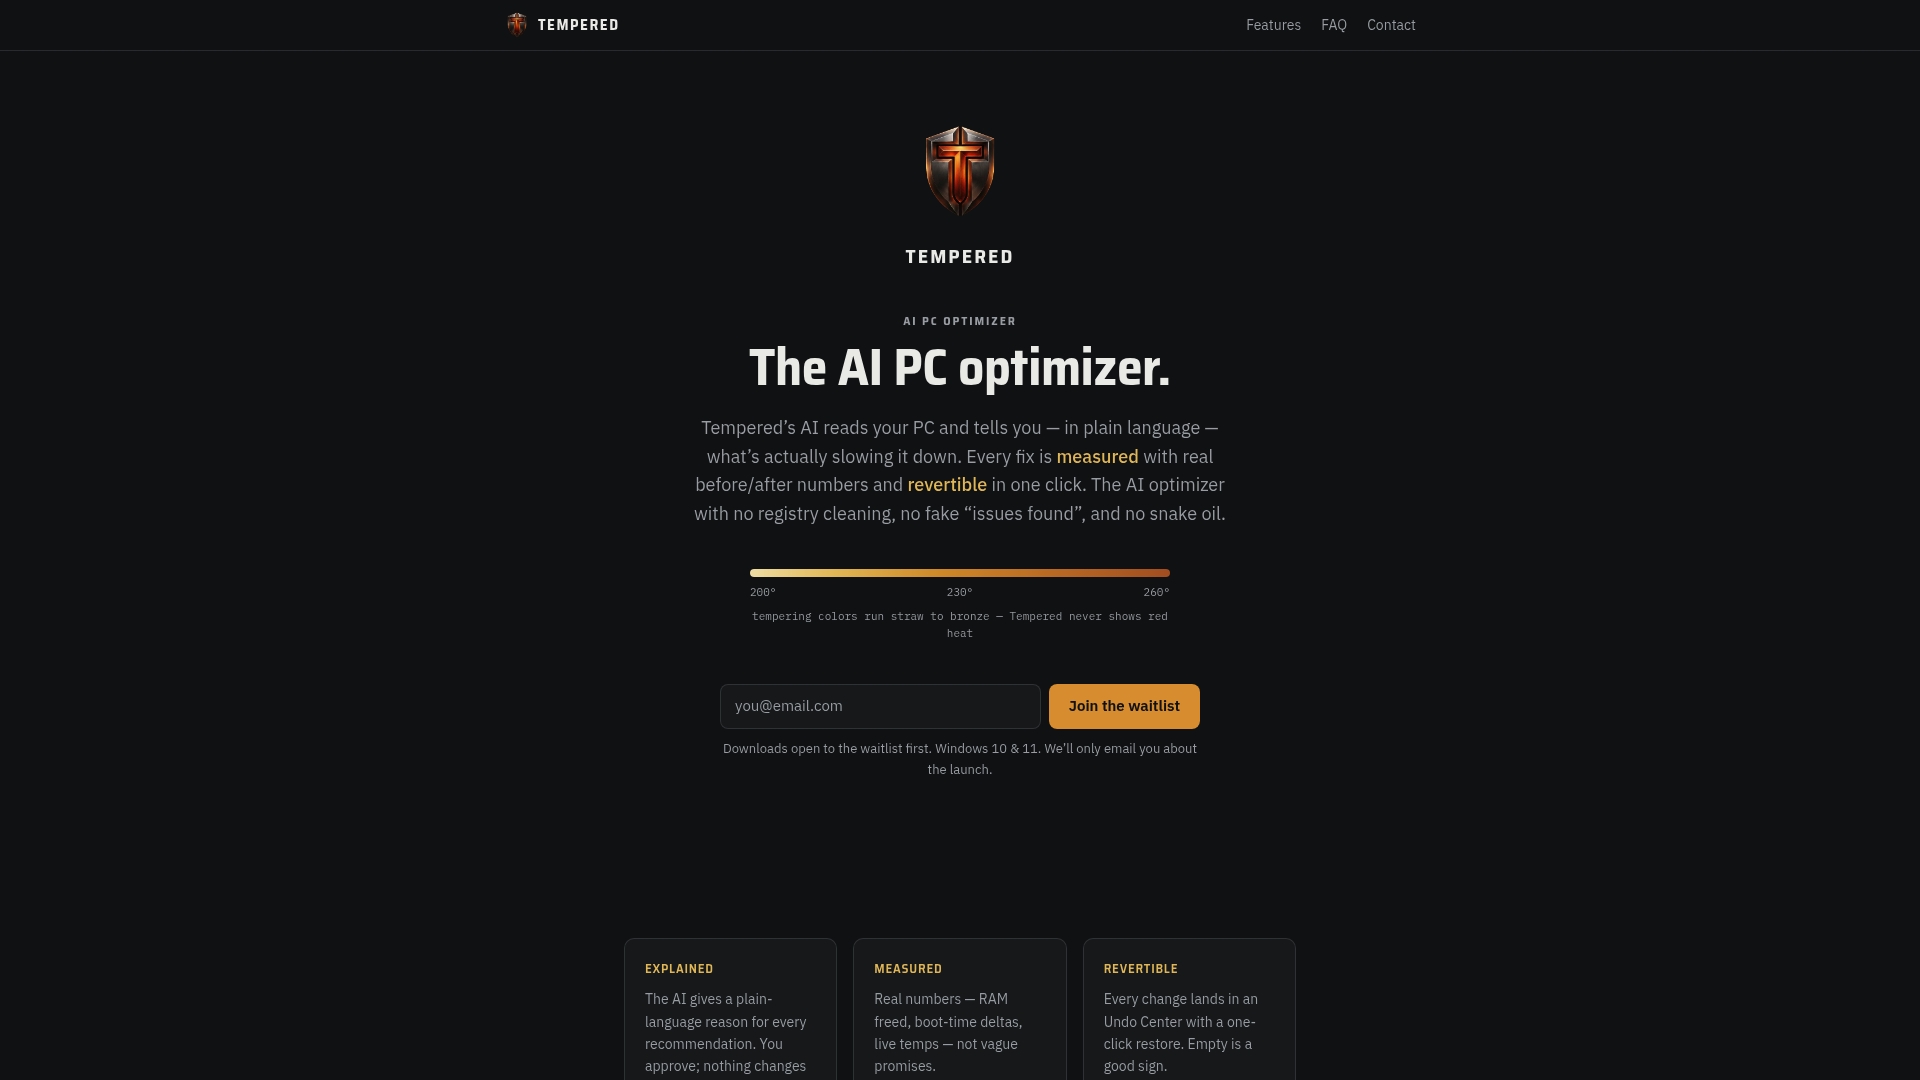
Every optimization Tempered recommends is logged in its Undo Center, so you can reverse any change with a single click. Background process management, Game Mode, startup customization, and performance tweaks are all covered, with no technical knowledge required. You get the monitoring depth of a dedicated sensor tool plus the guidance of an AI diagnostic layer, without juggling multiple apps or decoding raw sensor output.
Run a free scan with Tempered and see your system's thermal health in under a minute.