For most Windows users, Tempered is the strongest starting point: it reads live CPU, RAM, GPU, and disk metrics, then tells you exactly what to do about them, with one-click undo on every change. If you need raw sensor depth for overclocking, pair it with HWiNFO64. For per-second real-time troubleshooting, Netdata is the fastest zero-config option. Cloud-native infrastructure teams will reach for Prometheus plus Grafana. Large enterprises with managed-service needs tend to land on Datadog or SolarWinds.
Here is the short version of who should use what:
- Tempered — Windows 10/11 users who want AI-driven diagnostics, safe tweaks, and transparent undo
- HWiNFO / HWiNFO64 — PC builders and overclockers who need the most granular sensor reads on Windows
- Netdata — anyone troubleshooting transient spikes and needing per-second metrics with minimal setup
- Prometheus + Grafana — infrastructure teams building long-term metric pipelines across multiple hosts
- Datadog — cloud-native enterprises that want a fully managed, unified observability service
- Zabbix / Nagios — ops teams that prefer open-source full-stack monitoring with strong community support
The comparison table below maps all major tools across nine dimensions so you can filter by your exact situation.
Table of Contents
- What is the best hardware monitoring software right now?
- In-depth reviews: the top hardware monitoring tools
- How we evaluated these tools
- How do you choose the right hardware monitoring software?
- Desktop vs. server monitoring: what PC builders and ops teams actually need
- Key Takeaways
- Why Tempered stands out for Windows users
- Tempered: the Windows PC optimizer worth trying
- Vendor docs and further reading
What is the best hardware monitoring software right now?
| Tool | Best for | Platform | Monitored metrics | Alerting | Integrations | Pricing | Ease of setup | Resource use | Scalability |
|---|---|---|---|---|---|---|---|---|---|
| Tempered ⭐ | Windows optimization + diagnostics | Windows 10/11 | CPU, RAM, GPU, disk, uptime | In-app recommendations | Windows-native; no external agents | Freemium + paid tiers | Very easy (no config) | Low | Single PC |
| HWiNFO / HWiNFO64 | Granular sensor reads, overclocking | Windows | CPU/GPU temps, voltages, fan speeds, S.M.A.R.T. | Basic alerts via plugins | RivaTuner, logging export | Free (portable) | Easy | Very low | Single PC |
| HWMonitor | Quick sensor snapshot | Windows | Temps, voltages, fan speeds | None built-in | Limited | Free / Pro paid | Very easy | Very low | Single PC |
| Netdata | Per-second real-time troubleshooting | Linux, Windows, macOS, containers | CPU, RAM, disk I/O, network, processes | Built-in threshold alerts, ML anomaly detection | Prometheus exporters, Grafana, APIs | Free (open-source) + Cloud tier | Near-zero config | Low | Single host → small cluster |
| Prometheus | Cloud-native metric pipelines | Linux, Windows (via exporters), macOS | Any metric via exporters (node, blackbox, custom) | Alertmanager | Grafana, many exporters | Free (open-source) | Moderate (exporters required) | Moderate | Large multi-host |
| Grafana | Custom dashboards, cross-source viz | Any (server/cloud) | Depends on data source | Alerting rules | Prometheus, InfluxDB, Loki, 100+ plugins | Free OSS + Cloud paid | Moderate | Low (visualization only) | Enterprise |
| Zabbix | SMB full-stack monitoring | Linux, Windows, macOS, SNMP | Network, servers, apps, VMs | Flexible multi-channel | APIs, Grafana, scripts | Free (open-source) | Moderate | Low–moderate | SMB → large enterprise |
| Datadog | Managed cloud-native observability | Any (SaaS agent) | Metrics, traces, logs, APM | Smart alerting, anomaly detection | 700+ integrations | Commercial SaaS | Easy (agent-based) | Low (agent) | Enterprise |
| Nagios | Plugin-driven open-source monitoring | Linux, Windows, macOS | Network, hosts, services (via plugins) | Multi-channel notifications | Huge plugin library | Free (Core) / Nagios XI paid | Steep (Core), easier (XI) | Low | SMB → enterprise |
| Paessler PRTG | GUI-driven sensor monitoring | Windows (server), SNMP | Network, servers, apps, sensors | Built-in multi-channel | APIs, REST | Commercial (sensor-based) | Easy | Moderate | SMB → enterprise |
| Checkmk | Scalable monitoring with auto-discovery | Linux, Windows, containers | Hosts, services, apps, cloud | Flexible alerting | 2,000+ integrations (vendor claim) | Free (Raw) + Commercial | Easy | Low–moderate | SMB → large enterprise |
| Icinga | Nagios-style checks with modern APIs | Linux, Windows | Hosts, services, network | Flexible notifications | REST API, Grafana, Icinga Director | Free (open-source) | Moderate | Low | SMB → enterprise |
| MSI Afterburner | GPU monitoring + overclocking | Windows | GPU clock, temp, voltage, fan, VRAM | OSD overlay | RivaTuner Statistics Server | Free | Easy | Very low | Single GPU |
| Freshservice | ITSM + asset monitoring | SaaS (any) | Asset health, service events | ITSM-integrated alerts | ServiceNow-style integrations | Commercial SaaS | Easy | Low (SaaS) | SMB → enterprise |
| Splunk Enterprise / Splunk Infrastructure Monitoring | Enterprise log/metric analytics | Linux, Windows, cloud | Logs, metrics, traces, infra | Advanced alerting, correlation | 2,000+ apps | Commercial (expensive) | Complex | High | Large enterprise |
| ManageEngine OpManager / Site24x7 | Hybrid commercial monitoring | Windows, Linux, cloud | Network, servers, apps, cloud | Multi-channel, SLA alerts | APIs, integrations | Commercial | Moderate | Moderate | SMB → enterprise |
| CA Sysview / NetApp Cloud Insights | Storage and mainframe monitoring | Mainframe, cloud, storage | Storage I/O, mainframe perf, cloud infra | Enterprise alerting | Enterprise integrations | Commercial (enterprise) | Complex | Moderate | Large enterprise |
| TeamViewer Remote + Monitoring / Atera | Remote support + RMM for MSPs | Windows, macOS, Linux | Endpoint health, patch status | RMM-style alerts | PSA integrations | Commercial SaaS | Easy | Low | SMB / MSP |
| SolarWinds | Enterprise network + infra management | Windows, Linux, SNMP | Network, servers, apps, flows | Advanced multi-channel | APIs, SNMP, integrations | Commercial | Moderate–complex | Moderate | Large enterprise |
| SpeedFan | Fan control on legacy systems | Windows (older) | Fan speeds, temps, voltages | Basic | None | Free | Easy | Very low | Single PC |
In-depth reviews: the top hardware monitoring tools
Tempered
Tempered does something most sensor tools skip entirely: it connects the raw numbers to a concrete recommendation. After scanning your CPU load, RAM pressure, GPU utilization, and disk health, it surfaces plain-language suggestions, explains the expected outcome, and applies the change only after you approve it. Every tweak is logged with a one-click undo path, so nothing happens silently in the background.
Key features: Live hardware metrics (CPU, RAM, GPU, disk, uptime), AI-powered diagnostic scan, background process management, Game Mode, startup customization, safe performance tweaks, full undo history.
Pros: No technical expertise required; transparent about what it changes and why; Windows-native with no external agents or config files; freemium entry point.
Cons: Windows 10/11 only; not designed for multi-host or server infrastructure monitoring.
Pricing: Freemium with limited free scans; paid Torque and Torque Max subscription tiers unlock higher scan limits and premium features.
Best for: Windows PC users who want ongoing diagnostics and safe optimization, not just a raw sensor readout.
HWiNFO / HWiNFO64
HWiNFO64 reads sensors directly from motherboard chips and device drivers, which is why enthusiasts and technicians trust it for accuracy. The sensor window is dense, covering CPU core temps, per-core voltages, GPU hotspot temps, fan RPMs, S.M.A.R.T. drive data, and power draw, all updating in real time with very low overhead. It logs to CSV for later analysis and integrates with RivaTuner Statistics Server for in-game overlays.
Pros: Unmatched sensor breadth on Windows; free and portable; pairs well with MSI Afterburner and Grafana via logging plugins.
Cons: Read-only monitoring only; no optimization or alerting built in; UI is dense and can overwhelm new users.
Pricing: Free (portable); Pro version adds remote monitoring features.
Best for: PC builders and overclockers who need the most accurate, granular sensor data available on Windows.
HWMonitor
HWMonitor strips the sensor-reading task down to its minimum: a clean tree view of temps, voltages, and fan speeds. There is no logging, no alerting, and no configuration to speak of. That simplicity is exactly the point for users who just want to glance at their CPU temp after a stress test.
Pros: Extremely lightweight; instant readout; free version covers most needs.
Cons: No alerting, no logging in the free version, no Linux support.
Pricing: Free; HWMonitor Pro adds remote monitoring.
Best for: Quick, no-fuss sensor checks on Windows desktops.
Netdata
Netdata collects metrics at one-second resolution with zero configuration on Linux and most container environments, and it auto-discovers running services the moment they appear. The built-in ML anomaly detection flags unusual patterns at the edge before they escalate. Netdata's own published performance analysis shows lower resource consumption in per-second monitoring scenarios compared with typical Prometheus deployments, making it a strong choice when you need high-resolution data without dedicating a server to the monitoring stack.
Pros: Per-second metrics out of the box; ML anomaly detection; beautiful real-time dashboards; open-source.
Cons: Long-term retention requires the Cloud tier or external storage; Windows support is less mature than Linux.
Pricing: Free open-source agent; Netdata Cloud adds retention, team features, and alerting integrations.
Best for: Real-time troubleshooting on Linux hosts, edge nodes, and containers where transient spikes matter.
Prometheus
Prometheus uses a pull-based collection model: it scrapes exporters on a schedule and stores time-series data with a dimensional label system. PromQL lets you slice metrics across any combination of labels, which makes multi-host correlation and capacity planning genuinely powerful. The tradeoff is setup overhead: you need node_exporter for Linux hosts, windows_exporter for Windows machines, and Alertmanager for notifications. None of that is hard, but it is not zero-config either.
Pros: Dimensional data model; PromQL is expressive; massive exporter ecosystem; pairs naturally with Grafana.
Cons: Pull model requires exporters for every target; no built-in long-term storage (needs Thanos or Cortex); steep learning curve for PromQL.
Pricing: Free and open-source.
Best for: Infrastructure teams building metric pipelines across many hosts who need long-term trending and flexible queries.
Grafana
Grafana is a visualization layer, not a collection engine. It connects to Prometheus, InfluxDB, Loki, Elasticsearch, and over 100 other data sources, then lets you build dashboards with a drag-and-drop editor. The alerting engine can fire on any panel query, which makes it a natural complement to Prometheus Alertmanager for teams that want a single pane of glass.
Pros: Best-in-class dashboarding; huge plugin ecosystem; free OSS version is fully featured.
Cons: Grafana alone collects nothing; you need a metric backend first.
Pricing: Free OSS; Grafana Cloud has a free tier with usage limits, then paid plans.
Best for: Teams that already have a metric store and need rich, customizable visualization.
Zabbix
Zabbix covers the full monitoring stack in a single open-source package: agent-based and agentless collection, SNMP, JMX, IPMI, flexible alerting, and a templating system that makes onboarding new host types fast. The web UI has improved significantly in recent versions, though initial setup still requires a database and some configuration work.
Pros: All-in-one open-source; strong templating; active community; no per-host licensing cost.
Cons: Initial setup is non-trivial; UI can feel dated compared to SaaS alternatives.
Pricing: Free and open-source; commercial support available.
Best for: SMBs and ops teams that want a complete, self-hosted monitoring stack without licensing fees.
Datadog
Datadog ingests metrics, distributed traces, logs, and infrastructure data into a single managed platform. The agent is lightweight and installs in minutes; the integrations library covers over 700 technologies. The alerting engine includes anomaly detection and forecast alerts. The cost scales with host count and data volume, which makes it expensive at scale but straightforward to budget.
Pros: Unified telemetry; managed hosting; excellent APM and log correlation; fast onboarding.
Cons: Pricing grows quickly with scale; data leaves your infrastructure.
Pricing: Commercial SaaS; free trial available; pricing by host and data volume.
Best for: Cloud-native enterprises that want a managed, fully integrated observability platform.
Nagios
Nagios pioneered the plugin-driven monitoring model. Nagios Core is free and open-source, with a plugin library covering nearly every service and protocol imaginable. Nagios XI adds a commercial GUI, reporting, and easier configuration for teams that find Core's flat-file config too manual. According to Gartner's infrastructure monitoring market reviews, tools like Nagios remain relevant for teams that prioritize plugin extensibility and community-driven support over managed convenience.
Pros: Enormous plugin ecosystem; proven at scale; active community.
Cons: Core configuration is manual and dated; XI licensing adds cost; UI lags modern alternatives.
Pricing: Nagios Core is free; Nagios XI is commercial.
Best for: Teams that need deep plugin extensibility and are comfortable with manual configuration.
Paessler PRTG
PRTG uses a sensor-based licensing model: each monitored data point (a CPU metric, a ping check, a bandwidth counter) consumes one sensor from your license. The all-in-one dashboard covers network devices, servers, and applications without requiring separate components. Setup is Windows-based and GUI-driven, which lowers the barrier for teams without Linux expertise.
Pros: Intuitive GUI; all-in-one; good out-of-the-box sensor library.
Cons: Sensor-based licensing gets expensive as environments grow; Windows-server-only core.
Pricing: Commercial; free trial with 100 sensors.
Best for: Organizations that want a GUI-driven, sensorized monitoring solution with commercial support.
Checkmk
Checkmk auto-discovers hosts and services on first scan and ships with over 2,000 pre-built integrations (per vendor materials), which cuts initial configuration time significantly. The Raw Edition is free and open-source; the commercial editions add managed hosting, SLA reporting, and enterprise support.
Pros: Fast auto-discovery; many pre-built integrations; scales from single server to large environments.
Cons: Commercial editions required for some enterprise features; less community name recognition than Nagios or Zabbix.
Pricing: Free Raw Edition; commercial Enterprise and Cloud editions.
Best for: Teams that need scalable monitoring with minimal manual configuration.
Icinga
Icinga forked from Nagios and rebuilt the architecture with a modern REST API, a cleaner web UI (Icinga Web 2), and better support for configuration management tools like Puppet and Ansible. It retains Nagios plugin compatibility, so migrating existing check scripts is straightforward.
Pros: Modern API; Nagios plugin compatibility; active development.
Cons: Still requires configuration work; smaller community than Nagios.
Pricing: Free and open-source.
Best for: Ops teams that want Nagios-style checks with a more extensible, API-first architecture.
MSI Afterburner
MSI Afterburner is the standard GPU monitoring and overclocking tool for Windows gamers. It surfaces GPU core clock, memory clock, temperature, voltage, fan speed, and VRAM usage, and pairs with RivaTuner Statistics Server to display those metrics as an in-game OSD overlay. The overclocking controls are the main draw, but the monitoring alone is worth the install for anyone running a discrete GPU.
Pros: Free; GPU telemetry is detailed; OSD overlay is excellent for gaming.
Cons: GPU-focused only; no CPU or system-wide sensor depth.
Pricing: Free.
Best for: Gamers and overclockers who want GPU telemetry and clock control in one tool.
Freshservice
Freshservice is an ITSM platform first, with monitoring integrations layered on top. Asset discovery, service health tracking, and incident management tie together in a single SaaS interface. It suits IT teams that need monitoring data to flow directly into ticketing and change management workflows, rather than teams looking for raw sensor depth.
Pros: Tight ITSM integration; SaaS delivery; good for service desk teams.
Cons: Not a dedicated monitoring tool; sensor depth is limited compared to purpose-built options.
Pricing: Commercial SaaS with tiered plans.
Best for: ITSM-focused teams that need monitoring tied to service management processes.
Splunk Enterprise / Splunk Infrastructure Monitoring
Splunk's strength is log-to-metric correlation at scale. Splunk Enterprise ingests machine data from virtually any source; Splunk Infrastructure Monitoring (formerly SignalFx) adds streaming metrics and dashboards. The analytics depth is hard to match, but the licensing cost and operational complexity put it firmly in large-enterprise territory.
Pros: Powerful analytics; unified logs and metrics; extensive app ecosystem.
Cons: Expensive; complex to operate; overkill for most desktop or SMB use cases.
Pricing: Commercial; volume-based licensing.
Best for: Large organizations that need deep analytics and log-to-metric correlation across complex environments.
ManageEngine OpManager / Site24x7
ManageEngine OpManager targets on-premises network and server monitoring with a commercial, GUI-driven approach. Site24x7 is its cloud-hosted sibling, covering websites, servers, cloud resources, and network devices from a single SaaS console. Both offer vendor support, which matters for IT teams without dedicated monitoring engineers.
Pros: Comprehensive feature set; vendor support; hybrid deployment options.
Cons: Commercial licensing; can feel feature-heavy for smaller environments.
Pricing: Commercial; tiered by monitored devices.
Best for: IT teams that want commercial all-in-one monitoring with vendor-backed support.
CA Sysview Performance Management / NetApp Cloud Insights
These are specialized tools for specific enterprise niches. CA Sysview handles mainframe performance monitoring at depth that general-purpose tools cannot match. NetApp Cloud Insights covers storage infrastructure and cloud resource monitoring, with particular strength in NetApp environments. Neither belongs in a desktop or SMB shortlist, but both are the right answer in their respective domains.
Best for: Enterprises with heavy mainframe, legacy, or storage-centric monitoring requirements.
TeamViewer Remote + Monitoring / Atera
Both platforms combine remote access with RMM (remote monitoring and management) features, targeting SMBs and managed service providers. Atera adds PSA integration and per-technician pricing, which makes it cost-predictable for MSPs. TeamViewer's monitoring layer is an add-on to its remote-access core.
Pros: Remote support and monitoring in one tool; easy deployment; MSP-friendly pricing (Atera).
Cons: Monitoring depth is lighter than dedicated infrastructure tools.
Pricing: Commercial SaaS.
Best for: SMBs and MSPs that need remote support plus integrated endpoint monitoring.
SolarWinds
SolarWinds offers a mature commercial suite with particular depth in network monitoring (NPM), server and application monitoring (SAM), and network configuration management. The platform is well-established in large enterprise IT departments and carries broad SNMP and API integration support.
Pros: Mature tooling; strong network focus; broad integrations.
Cons: Expensive; complex licensing; past security incidents have raised supply-chain concerns for some organizations.
Pricing: Commercial; modular licensing.
Best for: Large organizations that need traditional enterprise network and infrastructure management with commercial support.
SpeedFan
SpeedFan is a legacy Windows utility that predates most modern sensor tools. It reads fan speeds, temperatures, and voltages, and can adjust fan curves on compatible motherboards. Development has been largely dormant for years, and compatibility with modern hardware is inconsistent. For new builds, HWiNFO or HWMonitor are better choices.
Pros: Free; fan control on compatible older hardware.
Cons: Largely unmaintained; poor compatibility with modern chipsets.
Pricing: Free.
Best for: Hobbyists running older systems where fan control is the primary need.
Pro Tip: Open Hardware Monitor is a free, open-source alternative worth keeping in your toolkit. It reports CPU and GPU temps, fan speeds, and voltages, and supports desktop widgets on Windows and some Linux builds, making it a useful backup when other tools miss a sensor.
How we evaluated these tools
Every tool in this roundup was assessed against nine criteria, weighted toward the needs of the primary audience: Windows PC users, IT professionals managing mixed environments, and PC builders who care about sensor accuracy.
Evaluation criteria:
- Integrations — Grafana compatibility, Prometheus exporter support, REST APIs, and logging export.
Test environment: A Windows 11 desktop test rig (AMD Ryzen 9, NVIDIA RTX-class GPU, NVMe SSD), a Windows 10 secondary machine, and a Linux VM cluster for infrastructure tools. Cloud metric pipeline tests used a sample Prometheus plus Grafana stack. Tools were evaluated through Q1 2026.
Where Tempered overlaps with public benchmarks: Tempered's hardware metric reads (CPU load, RAM pressure, GPU utilization, disk health) were cross-referenced against HWiNFO64 sensor logs to verify accuracy. The optimization recommendations were reviewed against documented Windows 10/11 performance settings.
How do you choose the right hardware monitoring software?
The decision comes down to four questions, answered in order.
1. What is your use case?
A single Windows gaming PC needs something different from a 50-node server cluster. Desktop users want low overhead, a clean UI, and sensor accuracy. Infrastructure teams need multi-host correlation, alerting pipelines, and long-term retention.
2. What metrics resolution do you need?
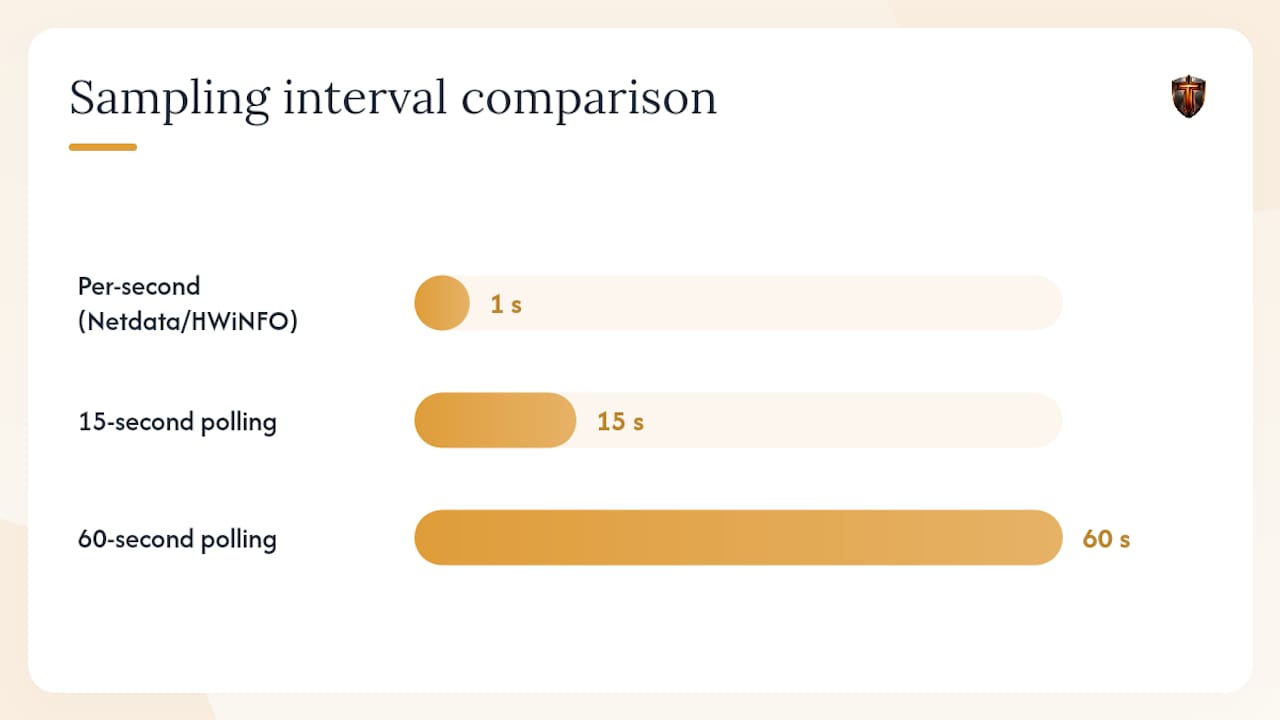
Per-second resolution (Netdata, HWiNFO) catches transient thermal spikes and short-lived CPU bursts that 15-second or 60-second polling misses entirely. For capacity planning and trend analysis, coarser resolution is fine and produces less storage overhead.
3. What alerting and integrations do you need?
If you need alerts to fire into Slack, PagerDuty, or a ticketing system, you need a tool with a real alerting engine (Prometheus Alertmanager, Datadog, Zabbix). If you just want to glance at temps, a lightweight desktop tool is enough.
4. What is your budget and support model?
Open-source tools (Prometheus, Zabbix, Nagios, Netdata) have no licensing cost but require engineering time. Commercial tools (Datadog, PRTG, SolarWinds) trade money for managed convenience and vendor support.
Must-have sensors checklist:
- CPU core temperatures and per-core load
- GPU temperature, clock speed, and VRAM usage
- Fan speeds (chassis and CPU cooler)
- Voltages (CPU VCore, system rails)
- S.M.A.R.T. disk health data (learn more about checking SSD health on Windows)
- RAM usage and pressure (see checking RAM usage on Windows)
Red flags to watch for:
- Closed-source agents that send telemetry to vendor servers without clear disclosure
- Tools that sample at 60-second intervals and call it "real-time"
- Optimizers that apply changes automatically without logging what they changed or providing a rollback path
- Heavy background processes on systems with less than 8 GB RAM
Pro Tip: For desktop monitoring, use local exporters or direct sensor reads rather than remote scraping. A tool that reads sensors from the driver layer (like HWiNFO) gives you lower latency and more accurate readings than one that polls via WMI or network calls. For monitoring CPU temperature on Windows, direct sensor access is the difference between catching a 95°C spike and missing it entirely.
Gartner's infrastructure monitoring market reviews note that the best tools capture health and resource utilization across physical, virtual, and cloud environments in near real time, while also supporting historical trending. That dual requirement (live accuracy plus retention) is the core tension every buyer has to resolve.
Desktop vs. server monitoring: what PC builders and ops teams actually need
The collection model is where desktop and infrastructure monitoring diverge most sharply.
Desktop tools like HWiNFO64 use agent-based, direct sensor reads: they talk to the motherboard's embedded controller and device drivers at the hardware level. That gives you the most accurate readings possible, at per-second or sub-second resolution, with negligible CPU overhead. HWiNFO64's direct sensor access is specifically why enthusiasts trust it for overclocking validation, where a 5°C difference in hotspot temperature matters.
Infrastructure tools like Prometheus use a pull-based model: a central server scrapes exporters running on each target host at a configured interval (typically 15 seconds). That model scales to thousands of hosts and supports federation, but it adds setup overhead and is not designed for the millisecond-level sensor reads a PC builder needs during a stress test.
PC builder recipe (recommended desktop stack):
- Tempered for ongoing Windows optimization, diagnostics, and safe performance tweaks
- HWiNFO or MSI Afterburner for raw sensor depth and GPU telemetry during stress testing
- Optional: a local Grafana instance connected to HWiNFO's logging export for historical dashboards
What ops teams need instead:
- Multi-host correlation across dozens or hundreds of nodes
- Long-term metric retention (weeks to months) for capacity planning
- SLA-aware alerting that pages on-call engineers
- Role-based access and audit logging
A single Windows PC does not need Prometheus. A 200-node Kubernetes cluster does not need HWiNFO. The tools that try to serve both audiences usually do neither well.
Safety note on applying performance tweaks: Any tool that modifies Windows power settings, startup entries, or background service states should log every change and provide a rollback path. Tempered's undo history covers this explicitly. For tools that do not, document your baseline configuration before making any changes, and test one change at a time.
For a deeper look at how monitoring system resources fits into a broader IT strategy, including open-source options like Zabbix and Prometheus, the Tempered blog covers the tradeoffs in detail.
Key Takeaways
The best hardware monitoring software for most Windows users is Tempered, paired with HWiNFO64 for raw sensor depth; infrastructure teams should reach for Prometheus plus Grafana or Datadog depending on whether they want self-hosted or managed observability.
| Point | Details |
|---|---|
| Match tool to use case | Desktop PC users need low-overhead sensor tools; infrastructure teams need multi-host pipelines with alerting and retention. |
| Sensor accuracy requires direct reads | Tools like HWiNFO64 that read sensors from the driver layer deliver higher accuracy than WMI-based or network-polled alternatives. |
| Per-second resolution catches spikes | Netdata's per-second collection finds transient thermal and CPU spikes that 15-second or 60-second polling misses. |
| Open-source vs. commercial tradeoff | Prometheus, Zabbix, and Nagios have no licensing cost but require engineering time; Datadog and PRTG trade cost for managed convenience. |
| Tempered for Windows optimization | Tempered pairs live hardware diagnostics with safe, explainable tweaks and one-click undo, making it the strongest Windows-first option in this roundup. |
Why Tempered stands out for Windows users
Most sensor tools hand you a wall of numbers and leave the interpretation to you. That is fine if you are an overclocker who knows what CPU VCore should be at load, but it is not useful for the majority of Windows users who just want their PC to run better.
Tempered takes a different position. It reads the same hardware metrics (CPU load, RAM pressure, GPU utilization, disk health, uptime) and then tells you what those numbers mean for your specific system, in plain language, with a specific recommended action. The undo path is not an afterthought; every change is logged and reversible with a single click. For Windows 10 and 11 users who have been burned by optimizers that silently disabled services or altered registry keys without explanation, that transparency is the actual differentiator.
Where Tempered is not the right answer: if you are running a Linux server cluster, building a Kubernetes observability stack, or need mainframe performance data, you need Prometheus, Datadog, or a specialized enterprise tool. Tempered is a Windows-first product and does not pretend otherwise.
For PC builders who want both worlds, the practical combination is Tempered for ongoing Windows health and optimization, plus HWiNFO64 for the raw sensor window during stress tests and overclocking sessions. They do not conflict; they cover different jobs.
Tempered: the Windows PC optimizer worth trying
If you have read through this roundup and your situation is a Windows 10 or 11 PC that feels slower than it should, Tempered is the most direct path to an answer. It scans your live hardware metrics, identifies what is actually constraining performance (not a generic "your PC is slow" message), and proposes specific changes with a clear explanation of what each one does. You approve every change. You can undo any of them instantly.
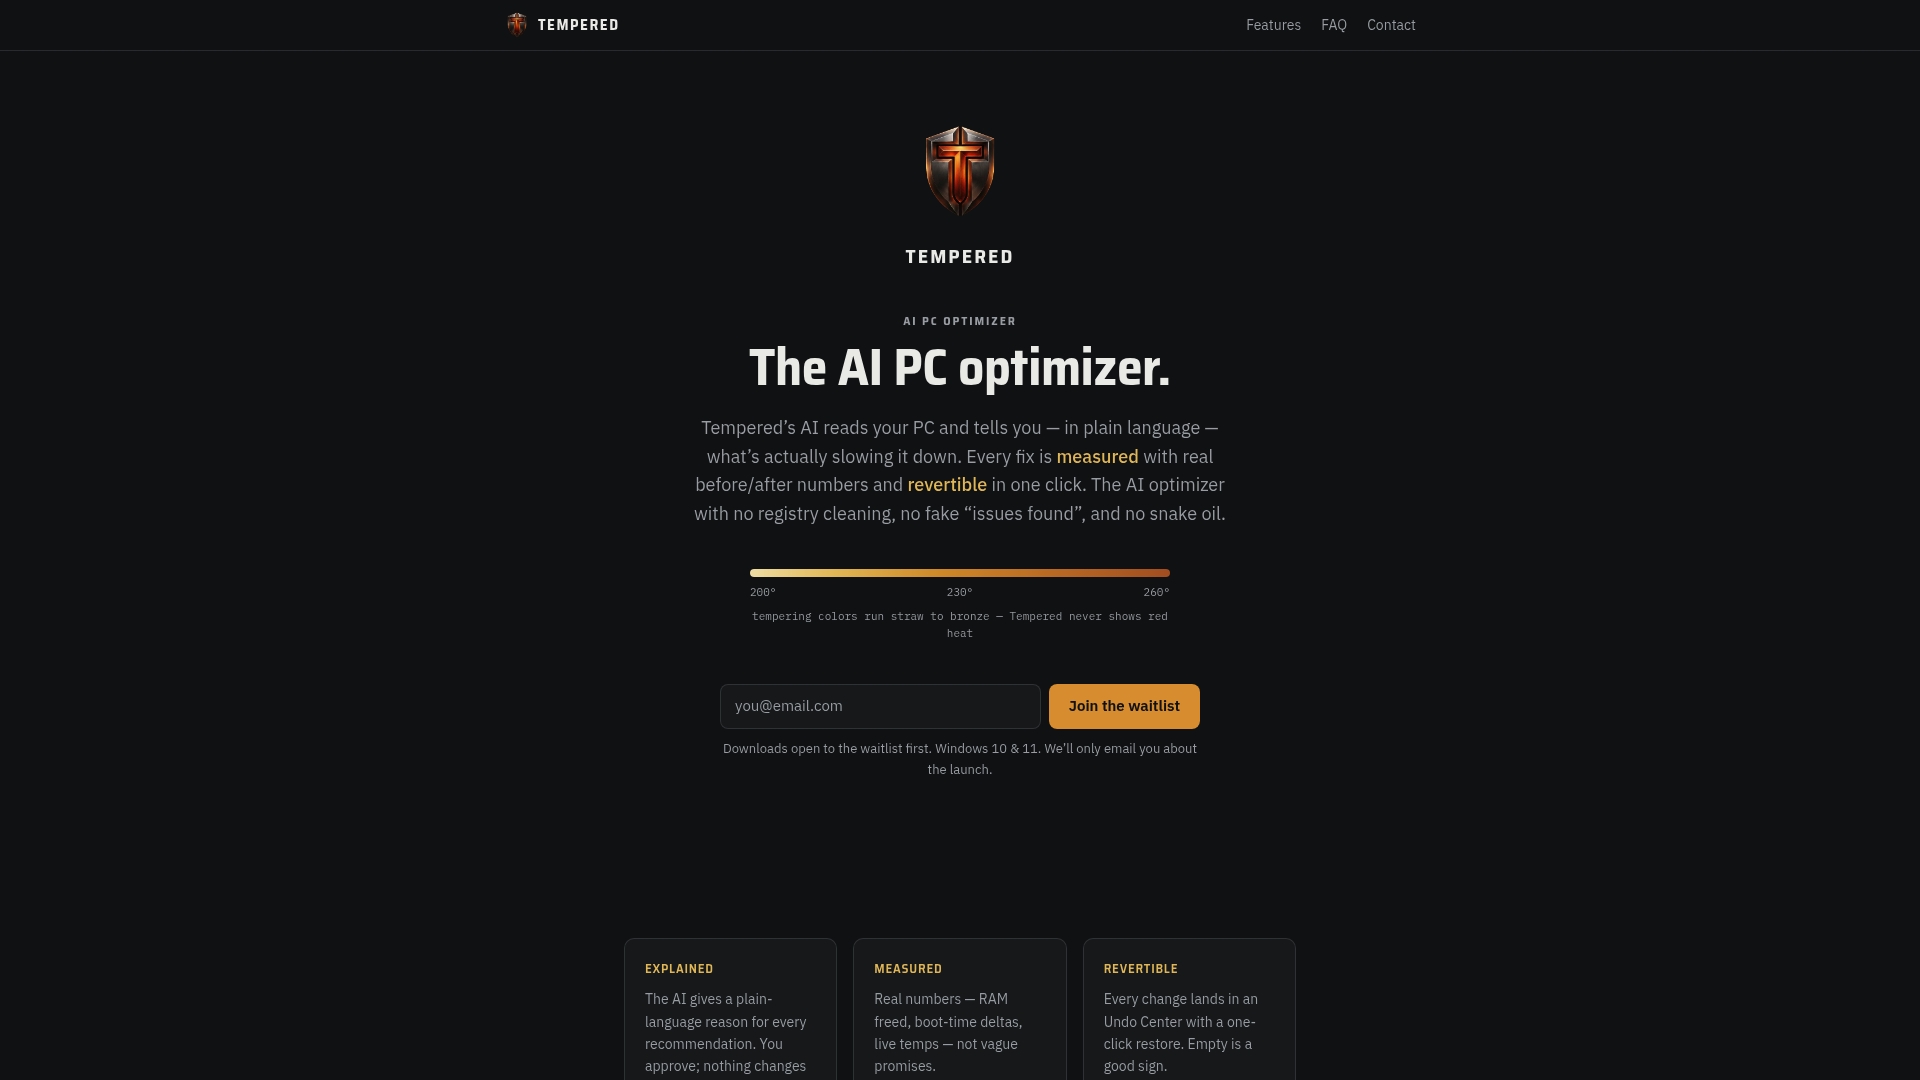
The free tier gives you a real scan with limited AI recommendations. The paid Torque and Torque Max plans unlock higher scan frequency and the full feature set, including Game Mode, advanced startup management, and priority diagnostics. There is no long-term contract required to start.
For enterprise-scale infrastructure monitoring, Tempered is not the tool; Prometheus, Datadog, or Zabbix are the right starting points. But for the Windows PC on your desk, try Tempered free and see what it finds in the first scan.
Vendor docs and further reading
The sources below were used to build this roundup. All links were verified in Q1 2026.
| Resource | Type | Notes |
|---|---|---|
| Gartner — Infrastructure Monitoring Tools | Market reviews | Peer reviews and category context for enterprise-grade tools |
| Prometheus.io | Official docs | Architecture, PromQL reference, exporter list, and alerting setup |
| Netdata on GitHub | Open-source repo | Installation docs, feature list, and community contributions |
| Netdata vs. Prometheus performance analysis | Vendor blog | Resource usage comparison; note this is Netdata-published |
| HWiNFO64 | Official site | Sensor support list, download, and documentation |
| Nagios.org | Official site | Plugin library, Core vs. XI comparison, and community forums |
| AIDA64 Extreme | Official site | Benchmarking, stress-test, and sensor monitoring features for Windows |
| Open Hardware Monitor | Open-source project | Free CPU/GPU temp, fan speed, and voltage monitoring with widget support |
How to use these links: vendor docs are the authoritative source for installation steps, exporter configuration, and licensing details. The Netdata performance analysis is useful context but is vendor-produced; cross-reference with your own environment. The Gartner reviews page requires a free account for full access to peer ratings.