
Open Task Manager with Ctrl+Shift+Esc, click the Processes tab, and click the CPU column header to sort every running process from highest to lowest usage. Whatever sits at the top of that list, for more than a few seconds at a time, is your CPU hog.
Here's the 60 second version:
- Press Ctrl+Shift+Esc to launch Task Manager instantly.
- Click Processes, then click the CPU column header once (click twice if it sorts ascending).
- Note the process name, its PID (right-click the column header and add "PID" if it's hidden), and whether it's a familiar app or a background service.
- Watch it for 10 to 15 seconds. A real hog stays near the top; a one-time spike from opening a program will fade fast.
Once you've spotted the process, don't rush to kill it. Check whether it's a user app you recognize (Chrome, a game, an editor) or something with "svchost.exe," "Antimalware Service Executable," or another system name attached to it.
Pro Tip: If the top process is a normal app like a browser or a game, right-click it and choose Efficiency mode or End task without worry. If it's a system process you don't recognize, keep reading before you touch it. Ending the wrong system process can crash background services or even force a reboot.
Key Takeaways
Finding a CPU hog in Windows 11 starts with Task Manager's Processes tab sorted by CPU, then escalates to Resource Monitor and Process Explorer only when the cause isn't immediately obvious.
| Point | Details |
|---|---|
| Start with Task Manager | Press Ctrl+Shift+Esc, sort Processes by CPU, and note the PID of the top consumer. |
| Confirm before acting | Check whether it's a recognizable app or a system service before ending anything. |
| Escalate methodically | Move to Resource Monitor for service-level detail, then Process Explorer for thread and publisher data. |
| Run housekeeping regularly | Windows Update, SFC/DISM, and a malware scan resolve many CPU issues without deep tracing. |
| Automate the repetitive cleanup | Tempered scans live CPU and RAM metrics and proposes reversible fixes for recurring background hogs. |
Table of Contents
- Find CPU Hog Windows 11 Issues in Under 5 Minutes
- Read Task Manager Correctly: Processes vs. Details vs. Performance
- Dig Deeper with Resource Monitor
- Use Process Explorer to Inspect svchost, Threads, and DLLs
- Common CPU Hogs on Windows 11 and What Fixes Them
- Isolate the Exact Service Inside svchost
- Run Housekeeping: Updates, Scans, SFC, DISM, and Clean Boot
- When to Keep Troubleshooting Manually vs. Use a Tool
- What Actually Works: A Practitioner's Take on the Right Sequence
- Let Tempered Handle the Repetitive Cleanup
- Sources
Find CPU Hog Windows 11 Issues in Under 5 Minutes
You don't need Sysinternals tools or a computer science degree for most CPU problems. Most of the time, the culprit reveals itself in Task Manager within the first minute, and the fix takes another two.
Start with the same move from above: Ctrl+Shift+Esc, sort Processes by CPU, and let it run for 15 to 20 seconds without touching anything. Watch for a process that refuses to drop, not one that spikes once and settles. A one-off spike usually means something just loaded into memory.
From there, the action depends entirely on what you're looking at.
- If it's a browser tab, a game, or any app you opened yourself, close it normally first. If it won't close, right-click and choose End task.
- If it's using a lot of CPU but you still need it open, right-click and select Efficiency mode to throttle it without fully closing it.
- If the process name includes "svchost.exe," "Antimalware Service Executable," "SearchIndexer," or "WmiPrvSE," do not end it yet. These host Windows services, and abruptly killing them can cause instability.
- If nothing obvious explains the spike and the process reappears after a restart, that's your cue to move into Resource Monitor next.
Pro Tip: Before you troubleshoot further, check the date. If the CPU spike started right after a Windows update or driver installation, give it 10 to 15 minutes. Background indexing and update-related services often chew through CPU right after a patch and then settle down on their own once they finish their one-time work.
If the process survives a restart and keeps climbing back to the top of your list, it's time to bring in tools built for exactly this.
Read Task Manager Correctly: Processes vs. Details vs. Performance
Task Manager has three tabs that all claim to show CPU usage, and they don't always agree with each other. That's not a bug in your PC. It's a change in how Microsoft calculates the numbers.
Since the July 2025 update (KB5062553), the Processes and Performance tabs switched to a metric called % Processor Utility, which factors in modern CPU boost clocks and frequency scaling. The Details tab still uses the older % Processor Time metric. That's why you might see a process reading 35% on the Processes tab and a different number for the same process on Details. Neither number is wrong. They're measuring slightly different things, and a former Microsoft engineer who helped build the original Task Manager has publicly explained why that inconsistency is baked into how modern chips report load.
For everyday troubleshooting, here's which tab actually earns your attention:
| Tab | Best for | What it shows |
|---|---|---|
| Processes | Quick triage, spotting the obvious hog | App-level CPU usage with % Processor Utility |
| Details | Precise per-process, per-core comparison | Raw % Processor Time, PID, command line |
| Performance | Overall system load and core-by-core graphs | Aggregate CPU history, not per-process detail |
To see the details that actually help you diagnose the problem, right-click any column header in the Details tab and add PID, Command line, and if it's available, Publisher. That last one tells you instantly whether a process belongs to Microsoft, a third-party vendor, or something you don't recognize at all.
Run through this short checklist before moving to heavier tools:
- Sort Processes by CPU and let it settle for 15 to 20 seconds.
- Expand any grouped background processes by clicking the arrow next to app names.
- Switch to Details and check the Command line column for context (a generic name like "svchost.exe" becomes meaningful once you see the full command).
- Confirm the Publisher field. "Microsoft Corporation" for a Windows process is expected; an unfamiliar publisher on something using heavy CPU deserves a closer look.
Pro Tip: When comparing numbers across tabs, trust the Details tab's % Processor Time for consistency, since it measures raw processor cycles rather than the boost-adjusted utility metric. It's the more stable number if you're tracking a process over multiple checks.
Dig Deeper with Resource Monitor
When Task Manager shows you a suspect but not the full story, Resource Monitor (resmon) is your next stop. It's already installed, and it shows per-thread and per-service detail that Task Manager simply doesn't surface.
- Press Windows key + R, type resmon, and hit Enter. Or search "Resource Monitor" from the Start menu.
- Click the CPU tab. You'll see every process, its current CPU usage, and its Average CPU, which smooths out short spikes so you can see sustained load more clearly.
- Scroll down to Services, where processes hosting multiple Windows services (like svchost.exe) get broken out with their Associated Handles and the specific service names running inside them.
- Look for duplicate entries. If you see three or four instances of the same executable, each pulling a modest amount of CPU, that combined load is often the real problem, not any single instance.
- Note the PID of your top suspect so you can carry it forward into Process Explorer if you need to go further.
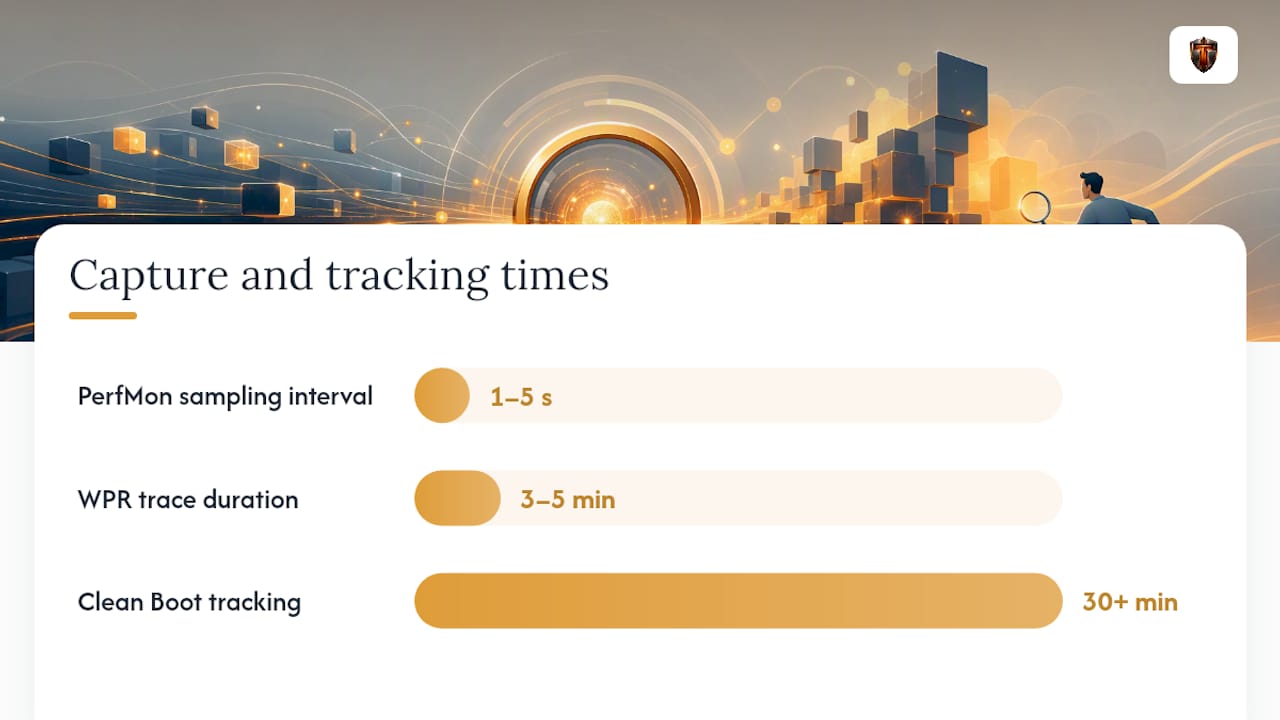
If the spike only shows up occasionally and disappears before you can catch it in Resource Monitor's live view, that's exactly the scenario Microsoft's own troubleshooting guidance addresses with logging. Set up a Performance Monitor data collector with a 1 to 5 second sampling interval, since that window is tight enough to catch transient spikes that a casual glance would miss entirely.
Pro Tip: Right-click any process in Resource Monitor's CPU tab and choose "Search Online" if the name is unfamiliar. It's faster than opening a browser separately, and it's often enough to confirm whether you're looking at a legitimate Windows component or something worth investigating further.

Use Process Explorer to Inspect svchost, Threads, and DLLs
Resource Monitor tells you which service is running. Process Explorer, a free tool from Microsoft's Sysinternals suite, tells you exactly what that service is doing and whether you can trust it.
You can download Process Explorer directly from Microsoft's Sysinternals site, no installer required. It's a portable executable, which matters if you're troubleshooting a machine you don't want to install extra software on permanently.
- Run Process Explorer as administrator. Without elevation, you won't get full access to system process details.
- Hover over any svchost.exe entry to see a tooltip listing every service running inside that instance, without needing Resource Monitor at all.
- Locate the PID you flagged earlier, right-click it, and select Properties.
- Click the Threads tab. Sort by CPU to see which individual thread is consuming cycles, then click Stack on the busiest thread to see the actual function calls it's executing.
- Check the Verified Signer column (visible by default in newer builds, or enabled through View > Select Columns). A process claiming to be a Windows component but signed by an unknown publisher is a red flag worth investigating immediately.
Watch for these signals as you dig through stack data:
- A stack full of names referencing update services or Windows Installer usually points to a pending or stuck Windows Update.
- Stack frames referencing a third-party vendor's DLL point you toward that app's installer or support page, not a Windows problem.
- Repeated calls into networking or cryptography libraries often mean malware or a misbehaving background sync tool, especially if the process has no visible window.
Pro Tip: Configure symbol paths under Options > Configure Symbols before you dig into stacks, pointing Process Explorer at Microsoft's public symbol server. Without symbols, stack traces show meaningless memory addresses instead of readable function names, which makes real diagnosis nearly impossible. For genuinely stubborn cases, Microsoft's guidance also recommends capturing a ProcDump trace of the offending process while it's active, which you can hand to a more technical friend or a support technician if you're stuck.
Common CPU Hogs on Windows 11 and What Fixes Them
Most CPU complaints trace back to a short list of repeat offenders. Recognizing them by name saves you from tearing apart Process Explorer stacks unnecessarily.
- Antimalware Service Executable (Windows Defender) shows up as high CPU right after a scheduled scan starts or a definition update lands. It typically settles within 10 to 20 minutes on its own; if it doesn't, schedule scans for idle hours through Windows Security settings.
- SearchIndexer.exe spikes after you add a lot of new files or reconnect an external drive, since Windows rebuilds its search index. Pausing indexing temporarily (Indexing Options > Modify > uncheck locations) resolves it within minutes, though a full rebuild on a large drive can take longer.
- SysMain (Superfetch) preloads apps into memory based on usage patterns and occasionally spikes CPU on older or slower storage. If it's consistently disruptive, disabling the service through Services.msc is safe on SSD-based systems, since Superfetch was designed with spinning hard drives in mind.
- svchost.exe running Windows Update services ramps up CPU while checking for or installing updates. Letting it finish, usually within a single reboot cycle, resolves most cases outright.
- WMI Provider Host (WmiPrvSE.exe) spikes when a third-party monitoring tool or driver queries system data too aggressively. Check which app is triggering it through Event Viewer's WMI-Activity log, then update or uninstall that app.
- Google Chrome and other browsers rack up CPU through unclosed tabs, autoplay video, or a stuck extension. Chrome's own Task Manager (Shift+Esc while Chrome is focused) isolates the specific tab or extension responsible.
- Poorly coded third-party apps, especially ones that run silently in the system tray, are often the least visible and easiest to fix once identified: check for updates first, and uninstall if the vendor hasn't patched a known bug.
Pro Tip: For apps you use occasionally but don't want fully closing in the background, Efficiency mode is the better move over uninstalling. It throttles CPU priority without removing the app, which matters for something like a sync client you still need running.
Isolate the Exact Service Inside svchost
svchost.exe groups multiple Windows services into a single process to save memory, which is efficient for your system but frustrating when you're trying to find which specific service is misbehaving. Ending svchost outright can knock out several unrelated services at once, so Microsoft's own guidance points to a safer method: breaking the suspect service into its own dedicated process temporarily.
- Open Resource Monitor or Process Explorer and identify the svchost PID consuming excessive CPU, along with the list of services running inside it.
- Open Command Prompt as administrator and run
sc config <servicename> type= own(note the space after the equals sign, which Windows requires) for the specific service you suspect. - Restart that service, either through Services.msc or with
net stop <servicename>followed bynet start <servicename>. - Run
tasklist /svcfrom an elevated prompt to confirm the service now has its own dedicated PID, separate from the shared svchost group. - Watch CPU usage on that isolated PID specifically. If it spikes while other svchost-hosted services stay quiet, you've confirmed your suspect.
- Once you've identified the problem, revert the change with
sc config <servicename> type= shareso the service returns to its normal shared configuration.
If the isolated service turns out to be something tied to a third-party driver or an enterprise management agent, Microsoft's troubleshooting documentation recommends collecting a short Windows Performance Recorder (WPR) trace while it's actively spiking, which gives vendor support teams the detail they need instead of a vague description.
Pro Tip: Always revert the sc config change once you've finished diagnosing. Leaving services permanently split out of svchost increases memory overhead across your system for no ongoing benefit.
Run Housekeeping: Updates, Scans, SFC, DISM, and Clean Boot
A surprising number of "mystery" CPU hogs disappear entirely once you run the maintenance checklist Windows almost never nags you about directly.
- Open Settings > Windows Update and install anything pending, including optional driver updates listed under "Optional updates." Outdated drivers are a common, invisible source of background CPU churn.
- Run a full scan through Windows Security > Virus & threat protection. Malware disguised as a legitimate-looking process name is more common than most people assume, and a full scan catches what real-time protection sometimes misses.
- Open Command Prompt as administrator and run
sfc /scannowto repair corrupted system files, which can cause services to misbehave and consume excess CPU trying to recover. - Follow that with
DISM /Online /Cleanup-Image /RestoreHealthif SFC reports errors it couldn't fix on its own. DISM repairs the underlying system image that SFC pulls from. - If a specific driver update coincided with the CPU spike starting, roll it back through Device Manager > right-click the device > Properties > Driver > Roll Back Driver.
- If the problem persists, boot into Safe Mode (Settings > Recovery > Advanced startup > Restart now) to see if the high CPU usage disappears. If it does, a third-party driver or startup app is responsible.
- Perform a Clean Boot (msconfig > Services > Hide all Microsoft services > Disable all, then check Startup apps in Task Manager) to methodically re-enable services and startup items one at a time until you find the trigger.
Timelines vary depending on which fix applies. A stuck update or a one-time indexing job typically resolves within a single reboot. Driver rollbacks and malware removal usually resolve within the same troubleshooting session. Tracking down a specific third-party app through Clean Boot testing can take longer, sometimes 30 minutes or more of methodical re-enabling.
If you're capturing performance data to send along with a support request, Microsoft's guidance recommends a 1 to 5 second sampling interval for Performance Monitor logs, tight enough to catch brief spikes, and a 3 to 5 minute WPR trace for capturing enough context around an intermittent issue without generating an unmanageably large file.
Pro Tip: Run Disk Cleanup and check your SSD's health alongside these steps. A failing or nearly full drive can cause processes to spend CPU cycles waiting on disk I/O, which shows up looking like a CPU problem even though storage is the actual bottleneck.
When to Keep Troubleshooting Manually vs. Use a Tool
Manual tracing works well when the problem has a clear shape: one app, one recent change, one repeatable trigger. It gets exhausting fast when the spike is intermittent, unexplained, or spread across multiple background services that keep shifting blame between each other.
Stick with the manual path when:
- Only one specific user app triggers the spike, and closing it resolves the issue immediately.
- The high CPU usage started right after a specific Windows Update or driver install, giving you an obvious starting point.
- You can reliably reproduce the spike by repeating a specific action, which makes isolating the cause in Resource Monitor or Process Explorer straightforward.
Consider a different approach when:
- The spike has survived a full housekeeping pass (updates, SFC/DISM, malware scan) and keeps coming back with no clear trigger.
- The problem is intermittent enough that catching it live in Resource Monitor feels like chasing a ghost.
- You're managing a machine where downtime for extended manual tracing isn't practical, like a work computer you rely on daily.
The advantage of a transparent, user-controlled optimizer over a blind "one-click fix" tool is control: you want to see exactly what's changing, why, and how to reverse it if something goes wrong. Startup bloat, background process management, and managed service tweaks are exactly the kind of repetitive cleanup where automation earns its keep, provided every change comes with a clear explanation and an undo path.
Pro Tip: Before installing any third-party optimizer, export a Performance Monitor log or take a screenshot of your current Task Manager process list. That baseline makes it easy to confirm afterward exactly what changed, and gives you something concrete to revert to if a change doesn't help.
What Actually Works: A Practitioner's Take on the Right Sequence
The biggest mistake people make when chasing a CPU hog isn't picking the wrong tool. It's skipping steps in the wrong order and jumping straight to drastic action before gathering enough evidence.
The sequence that minimizes risk is straightforward: Task Manager first for a fast triage, Resource Monitor second to confirm which service or thread is actually responsible, Process Explorer third if you need thread-level or publisher verification, and housekeeping last, since updates, scans, and repairs solve more problems than any manual trace ever will. Escalating to service isolation or a ProcDump capture only makes sense once you've collected real evidence that points somewhere specific.
The rule I'd hold to above all others: never end a system-hosted process you can't identify. A killed svchost instance doesn't just stop one annoying service, it can take down networking, audio, or update functionality along with it, turning a five-minute annoyance into an hour-long recovery. If a spike is intermittent and refuses to show itself during a live Resource Monitor session, that's exactly the situation Windows Performance Recorder exists for. A short 3 to 5 minute trace captures far more than staring at a live process list ever will.
Most people never need to go further than Resource Monitor. The ones who do usually already suspect it, because they've tried the update, the scan, and the restart, and the problem came right back.
Let Tempered Handle the Repetitive Cleanup
Manual tracing gets you precision. Tempered gets you speed, and for the recurring stuff, that trade-off usually wins. It's an AI-powered optimizer built specifically for Windows 10 and 11 that scans live CPU, RAM, GPU, and disk metrics, then proposes specific, plain-language changes rather than running silent, unexplained "optimizations" in the background.

Where Tempered saves real time: persistent startup bloat that keeps creeping back after every software install, background processes that repeatedly climb your CPU list for no obvious reason, and unclear service-level spikes where you'd rather see a clear recommendation than spend an evening in Process Explorer. Every suggested change comes with an expected outcome and a one-click undo, so you're never stuck wondering what got altered or how to reverse it if a tweak doesn't help.
Manual tracing through Process Explorer and Performance Monitor remains the right call for deep, per-thread developer-level debugging. Tempered isn't trying to replace that. It's built for the far more common case: repeated background noise eating your CPU that you'd rather fix in minutes than trace for an hour. If you've already run through Task Manager and Resource Monitor and want the cleanup automated from there, start a free scan with Tempered and see what it flags on your system.
Sources
A handful of Microsoft-built tools cover nearly every CPU diagnostic scenario you'll run into, from a 10 second glance to a multi-minute trace.
- Troubleshoot high CPU usage guidance (Microsoft Learn)
- July 8, 2025 update (KB5062553) Task Manager calculation changes (Microsoft Support)
- Original Task Manager creator explains why it lies to you about CPU usage (Tom's Hardware)
If you're planning to open a support case, this table covers the sampling settings Microsoft's guidance recommends for catching real evidence instead of guesswork.
When you do reach out for support, whether to Microsoft or a software vendor, attach the PID of the offending process, a short WPR trace, any ProcDump samples you captured mid-spike, and a Performance Monitor log covering the window when the issue occurred. That handful of files usually gets a diagnosis resolved far faster than a written description alone. If gaming performance is part of what's driving your CPU concerns, it's also worth checking whether GPU scheduling is configured correctly, since a CPU bottleneck during gameplay sometimes traces back to how work is split between your processor and graphics card. And if you're troubleshooting a system used for audio production, CPU load in a DAW behaves differently from general Windows usage, worth a look through Vector DSP's breakdown of CPU load in audio processing if plugins are part of the picture.