If your CPU sits at 95 to 100 percent while your GPU stays under about 90 percent, your CPU is the limiter. If your GPU is the one pinned at 95 to 100 percent while the CPU idles below roughly 80 to 90 percent, that's a GPU bottleneck, and it's usually the good kind. A GPU running near full tilt at your target resolution means you're getting everything that card has to offer.
Here's the 60 second version before you go digging deeper:
- Open Task Manager during gameplay and compare CPU% to GPU%.
- Drop your resolution for two minutes. If FPS jumps, the GPU was holding you back.
- Fire up MSI Afterburner with an RTSS overlay for a live, per-core read.
Quick check: a healthy gaming rig usually shows the GPU as the busier component, not the CPU. If your CPU keeps hitting triple digits while the GPU coasts, something's misallocating the workload before it ever reaches the graphics card.
One caveat worth flagging early: online bottleneck calculators are rough estimators built from generic benchmark averages. They can't see your RAM timings, your background processes, or how a specific game engine actually distributes load. Treat them as a starting guess, not a verdict. Live monitoring is what actually tells you the truth.
Key Takeaways
A reliable CPU GPU bottleneck check combines a quick Task Manager glance with overlay verification and a resolution test, in that order, before you consider any hardware upgrade.
| Point | Details |
|---|---|
| Read the thresholds correctly | CPU at 95 to 100 percent with GPU under 90 percent means CPU-bound; the reverse means GPU-bound. |
| Start with Task Manager, then verify | Task Manager catches obvious cases fast, but only an overlay shows per-core pinning and frametime lows. |
| Use resolution as a litmus test | A big FPS jump at lower resolution confirms a GPU limit; little change points to the CPU or platform. |
| Rule out impostors first | Thermal throttling, shader compilation, and background apps often mimic a hardware bottleneck. |
| Diagnose before you buy | Tempered scans live system metrics and applies safe, reversible fixes so you upgrade only when the data says to. |
Table of Contents
- How to Do a Cpu Gpu Bottleneck Check in Task Manager
- Why an MSI Afterburner Overlay Reveals What Task Manager Hides
- Does Lowering Resolution Fix Your FPS? Try This Test
- When to Break Out CapFrameX, HWiNFO64, and 3DMark
- Stutter That Isn't Actually a Hardware Bottleneck
- Fixes to Try Before You Buy a New CPU or GPU
- How Tempered Applies Live Diagnostics and Safe, Reversible Optimizations
- Run a Free Scan Before You Shop for Parts
- Frequently Asked Questions
- Sources
How to Do a Cpu Gpu Bottleneck Check in Task Manager
This is the fastest first pass, and you don't need to install anything.
- Open Task Manager and click over to the Performance tab.
- Launch your game and play a demanding scene, ideally something with lots of on-screen action, for about 30 seconds.
- Alt-tab back and compare the CPU and GPU utilization graphs.
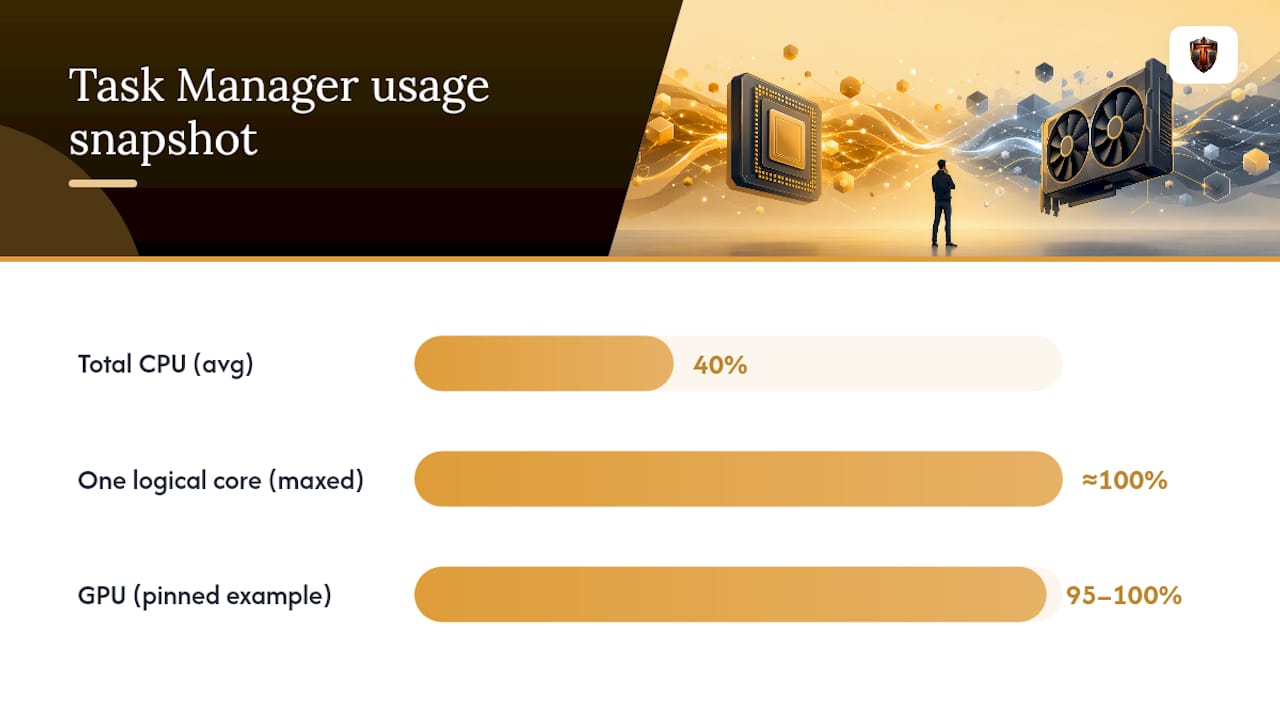
The thresholds that matter: CPU sitting at 95 to 100 percent while GPU stays under roughly 90 percent points to a CPU bottleneck. Flip that, with GPU pinned at 95 to 100 percent and CPU comfortably under 80 to 90 percent, and you're GPU-bound, which is typically fine.
The problem is that Task Manager only shows an averaged total, not per-core detail, and it gives you no frametime data at all. A game can be stuttering badly while total CPU usage reads at a deceptively calm 40 percent, because one thread is maxed out while seven others sit idle.
Pro Tip: Right-click the CPU graph in Task Manager and switch to "Logical processors" view. It won't show frametimes, but it's a free way to catch an obviously lopsided core before you install anything else.
Treat this step as a screening test, not a diagnosis. If the numbers look ambiguous or borderline, move on to an overlay.
Why an MSI Afterburner Overlay Reveals What Task Manager Hides
Task Manager tells you the temperature is rising. An overlay tells you why. Pairing MSI Afterburner with RTSS gives you a live, in-game readout of exactly what each component is doing frame by frame, and it's the tool most PC reviewers reach for first.
Set it up to display:
- Per-core CPU usage (not just the averaged total)
- GPU usage percentage, clock speed, and power draw
- FPS alongside frametime, plus 1% and 0.1% low markers
Once it's running, the interpretation gets a lot clearer. One core sitting at or near 100 percent while the rest are moderate is a classic single-thread CPU bottleneck, and it's a pattern Task Manager will never show you because it only reports the average across all cores. A GPU that's consistently at 95 to 100 percent with clocks and power draw holding steady is doing exactly what it should.
Overlays also catch things a static number never will. Watch the GPU usage line during an actual stutter. If it dips suddenly right as the frame hitches, the GPU wasn't the problem; it was waiting on the CPU to hand it work. That single pattern is one of the clearest tells in the entire diagnostic process.
Pro Tip: Log a five-minute session instead of just eyeballing the overlay live. Stutters that last a quarter of a second are easy to miss in real time but obvious once you scroll through a saved graph.
Does Lowering Resolution Fix Your FPS? Try This Test
Reviewers use this trick because it isolates the variable cleanly, and you can run it in under two minutes.
- Record your baseline FPS at your normal resolution and settings.
- Drop resolution drastically, say from 1440p down to 720p, or turn on an upscaler like DLSS/FSR at its most aggressive setting.
- Run the same scene again and compare the FPS numbers.
If frame rate jumps significantly, your GPU was the limiter; less work per frame at the graphics level let it breathe. If FPS barely moves, the bottleneck lives upstream, in the CPU or the platform feeding it.
This works because most of what the CPU handles per frame, physics, AI logic, draw calls, doesn't scale down with resolution the way pixel-shading work does. Cutting resolution mainly lightens the GPU's load, which is exactly why it makes such a clean test.
When to Break Out CapFrameX, HWiNFO64, and 3DMark
Overlays are usually enough. But when stutter is intermittent, or the numbers you're seeing don't cleanly point one direction, it's time to log instead of watch.
Run the same repeatable scene while capturing data with CapFrameX and HWiNFO64 together. The metrics worth logging:
- Frametime consistency, plus 1% and 0.1% lows
- GPU Busy percentage (a truer read than raw usage)
- Per-core CPU load across the run
- GPU power draw, clock speed, and VRAM usage
3DMark adds another layer: its sub-scores let you compare your CPU and GPU results against reference medians for similar hardware, which can expose a platform issue, like a power limit or a BIOS setting, that a plain utilization check would miss entirely.
Stutter That Isn't Actually a Hardware Bottleneck
Not every performance complaint is a CPU or GPU limit. Some of the most common misdiagnoses come from software or thermal issues wearing a bottleneck's clothing.
Real CPU bottleneck signs: GPU usage dips noticeably during stutters, one core reads pinned in your overlay, and lowering GPU-heavy settings (ray tracing, resolution) does almost nothing to your FPS.
Real GPU bottleneck signs: the GPU holds at 95 to 100 percent with stable clocks and power draw, and FPS climbs when you lower GPU-heavy settings.
But watch for these impostors:
- Thermal throttling shows up as clock speeds that sag over time under sustained load, not a flat usage number.
- Shader compilation and asset streaming cause sharp, one-time frametime spikes even on a perfectly balanced system, since storage stalls and shader loading aren't a CPU or GPU capacity problem at all.
- Background recording software or a stray frame cap silently steals headroom that looks identical to a genuine bottleneck in Task Manager.
Quick reality check: before you blame either chip, glance at temperatures and background CPU usage first. That single habit catches a surprising share of "upgrade-worthy" problems that were never a hardware limit to begin with.
Fixes to Try Before You Buy a New CPU or GPU
Run through these before spending a dollar on new silicon.
- Check thermals: clean dust from fans and heatsinks, confirm your cooler is seated properly, and verify boost clocks are actually hitting their advertised targets. Monitoring CPU temperature directly during a stress scene will tell you fast if throttling is the real culprit.
- Update GPU drivers, close background apps eating CPU cycles, and set Windows to a high-performance power plan.
- Enable XMP or EXPO in your BIOS, confirm your RAM is installed in the correct dual-channel slots, and move the game to an NVMe SSD if it's still on a hard drive.
- Tune settings by bottleneck type: lower draw distance and crowd density for CPU relief, or dial back ray tracing and native resolution for GPU relief.
Pro Tip: A single stick of RAM running in single-channel mode can look almost exactly like a CPU bottleneck in some titles. Confirm dual-channel before you conclude anything about your processor.
How Tempered Applies Live Diagnostics and Safe, Reversible Optimizations
Tempered scans live CPU, GPU, RAM, and disk metrics and explains, in plain language, which constraints are actually holding your system back. Every suggested change comes with a clear before-and-after expectation and a tracked undo, so you can test a fix, like adjusting startup apps or trimming background processes, without gambling on your setup. It won't replace an overlay session, but it catches the software-side noise that often gets mistaken for a hardware limit.
When a GPU bottleneck is fine, and when it isn't
A GPU pinned near 100 percent at your target resolution is usually the outcome you want. Consider a CPU upgrade only when per-core pinning shows up consistently across the games you actually play, or when you're chasing high refresh rates competitively. Even then, weigh the real FPS gain against resale value and whether a driver update or a settings tweak gets you most of the way there for free.
Run a Free Scan Before You Shop for Parts
There are other ways to chase this down: standalone overlays, manual driver hunts, forum troubleshooting threads. All of them work, but they take time and leave the software-side guesswork to you. Tempered shortcuts that process. It runs a live scan across your CPU, GPU, RAM, and disk, explains which constraints are actually limiting performance in plain language, and offers specific, reversible changes instead of a black-box "optimize everything" button.
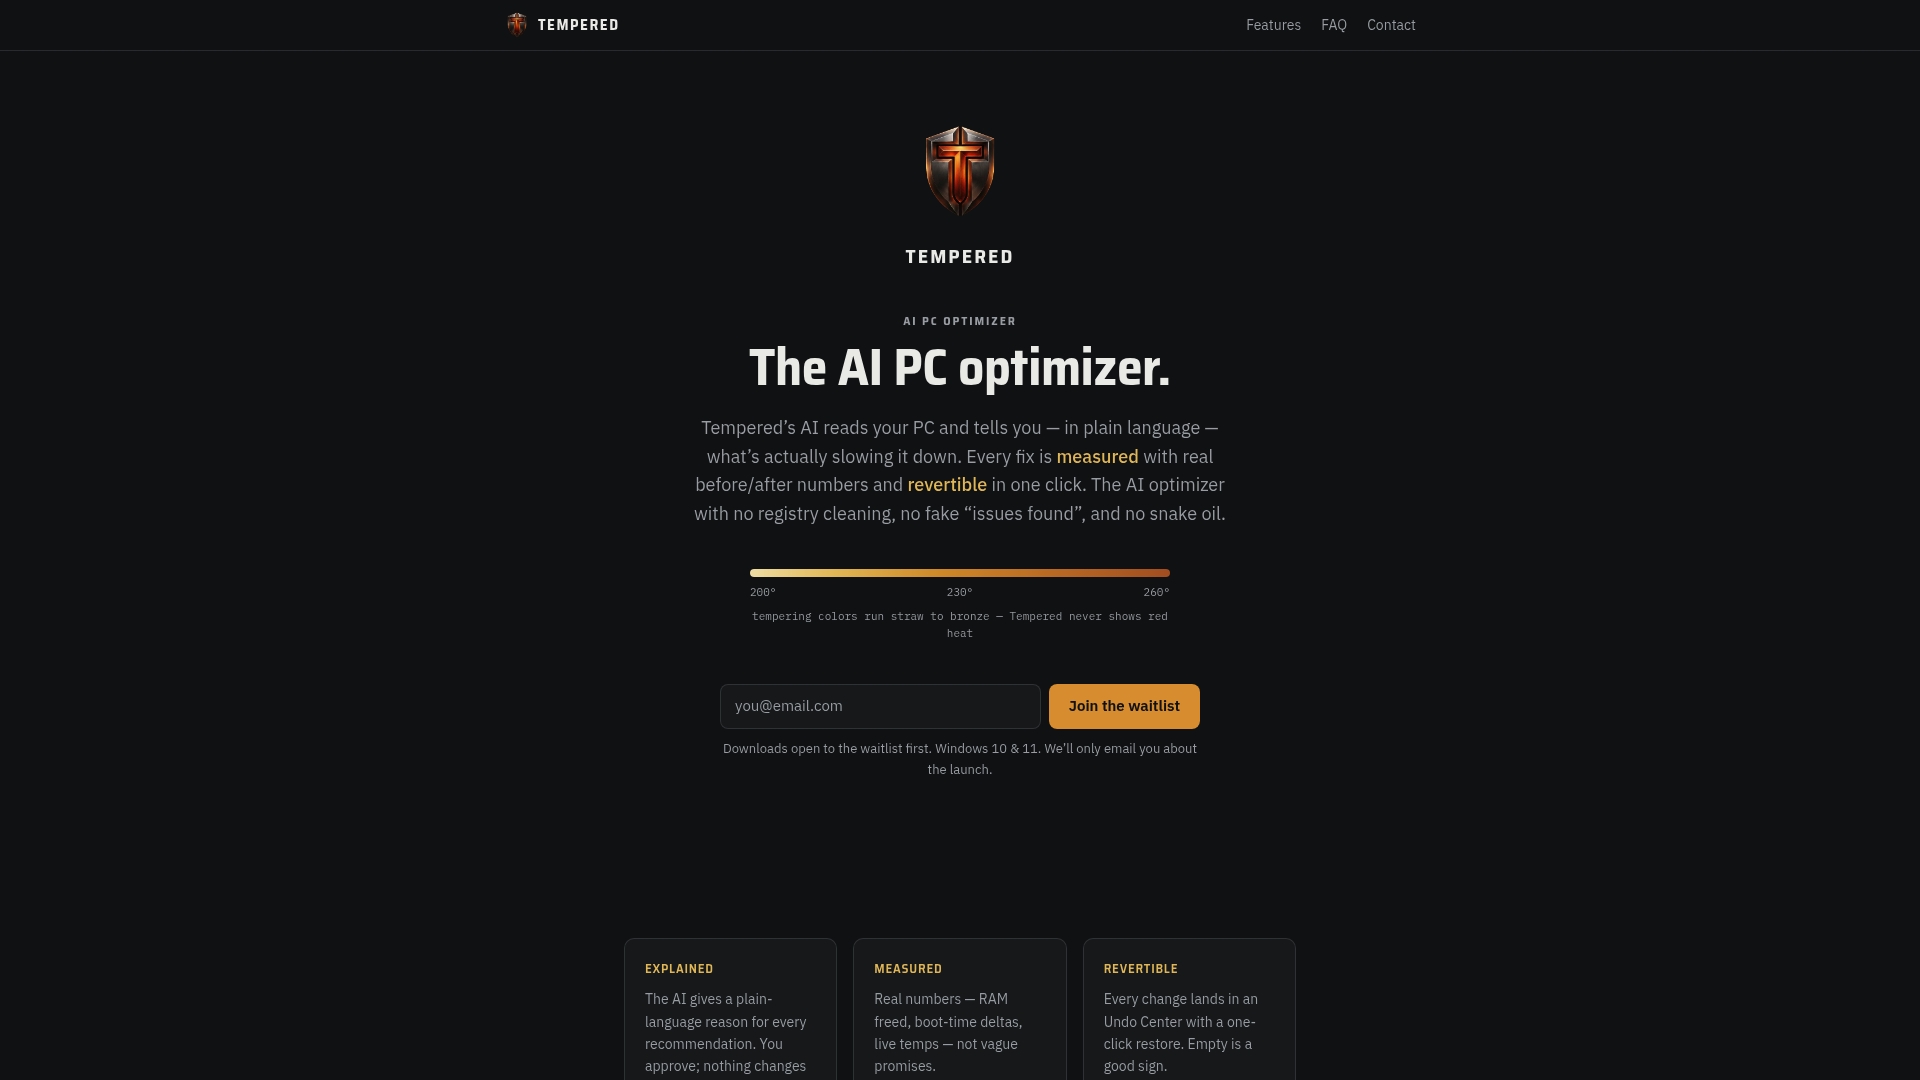
That distinction matters for your wallet. If a background process is eating 20 percent of a core, or your Windows power plan is quietly capping clocks, no new GPU is going to fix that. Tempered surfaces those issues first, with a one-click undo on every change, so you're never testing blind. If the diagnosis still points to real hardware limits after that, at least you'll know the money is actually going where it needs to. Run a free scan at Tempered and see what's really limiting your frame rate before you spend on anything else.
Frequently Asked Questions
How do I know if my CPU is bottlenecking my GPU? Check Task Manager during gameplay. If CPU usage sits at 95 to 100 percent while GPU usage stays well under 90 percent, your CPU is the limiter. Confirm it with an Afterburner overlay showing a pinned core.
What are the main GPU bottleneck symptoms? GPU usage holding steady at 95 to 100 percent with stable clocks and power draw, plus FPS that climbs noticeably when you lower resolution or graphics settings.
Is a bottleneck calculator accurate enough on its own? No. Calculators estimate from generic benchmark averages and can't see your actual RAM configuration, background load, or the game engine's real behavior. Use one for planning, then confirm with live monitoring.
Can drivers or thermal throttling cause fake bottleneck symptoms? Yes. Outdated drivers, background recording software, and thermal throttling all produce stutter or usage patterns that look like a hardware bottleneck but resolve with a fix rather than an upgrade.
Should I upgrade my CPU or GPU first? Upgrade whichever component consistently shows the bottleneck symptoms across the games you actually play, and only after ruling out thermal, driver, and background-process issues first.
Sources
For deeper setup help, see Tempered's guides on monitoring system resources and updating GPU drivers, plus this breakdown of thermal management basics.